A Barometer for Consumer Purchasing Power
Key Takeaways
The combination of data from surveys on household spending and supply chain disruptions helps to explain how consumers' purchasing behaviors are adapting to elevated inflation.
Products or services that experienced higher annual rates of inflation in June also tended to be those that consumers were either most willing to walk away from purchasing or most likely to trade down to cheaper alternatives.
The Consumer Purchasing Power Barometer outlined here helps in part to explain the connection between rising price levels and fewer or smaller purchases, providing a leading signal that momentum in inflation-adjusted spending growth is fading as inflation tightens its grip on the consumer wallet.
In March 2022, Morning Consult released our new methodology for tracking the real-time effects of supply chain disruptions on consumer purchasing behavior. As part of that methodological revision, we also created five indexes summarizing the consumer experience of these disruptions. Two of those five indexes (Price Sensitivity and Substitutability) were focused narrowly on the most obvious side effect of snarled supply chains: inflation. At the time of that release, the U.S. Consumer Price Index was up about 7.9% from a year ago. Four months later, that number is now at a fresh 40-year high of 9.1%.
In this memo, we delve deeper into the relationship between price sensitivity, substitutability and inflation. Using the variation across the product and service categories that underlie both our indexes and the Consumer Price Index, we demonstrate that there’s a strong connection between inflation and both price sensitivity and substitutability. Categories that experienced higher annual rates of inflation in June also tended to be those that saw the most sticker shock and trading down. As is always the case, however, there are exceptions to these rules, and they end up being quite informative as to why certain categories show up as outliers.
Building on these results, we then use data from Morning Consult’s Household Finances and Spending Survey to demonstrate that regional inflation-adjusted consumer spending patterns are strongly negatively associated with both price sensitivity and substitutability. This is true even after we control for fixed regional factors potentially correlated with both. It is this connection between these two indexes and consumer spending that prompted us to combine our Household Finances & Spending and U.S. Supply Chains & Inflation reports under the single banner of Consumer Spending & Inflation.
How category-level spending intersects with inflation
As part of the release of our new Consumer Spending & Inflation report in August, we will be including for the first time our Consumer Purchasing Power Barometer. The CPPB combines our Price Sensitivity and Substitutability indexes into a single value, thereby providing a snapshot of the impact of inflation on consumer purchasing power across a variety of products and services.
The Price Sensitivity and Substitutability indexes each capture the difference between two survey numbers that illustrate aspects of consumer purchasing behavior. One number provides a baseline for comparison (the control purchasing behavior), while the other isolates a particular behavior of interest (the tested purchasing behavior). By taking the difference between them, we can describe when the behavior of interest is more or less prevalent than its opposite result. (The full methodology and list of questions that inform the indexes can be found here.)
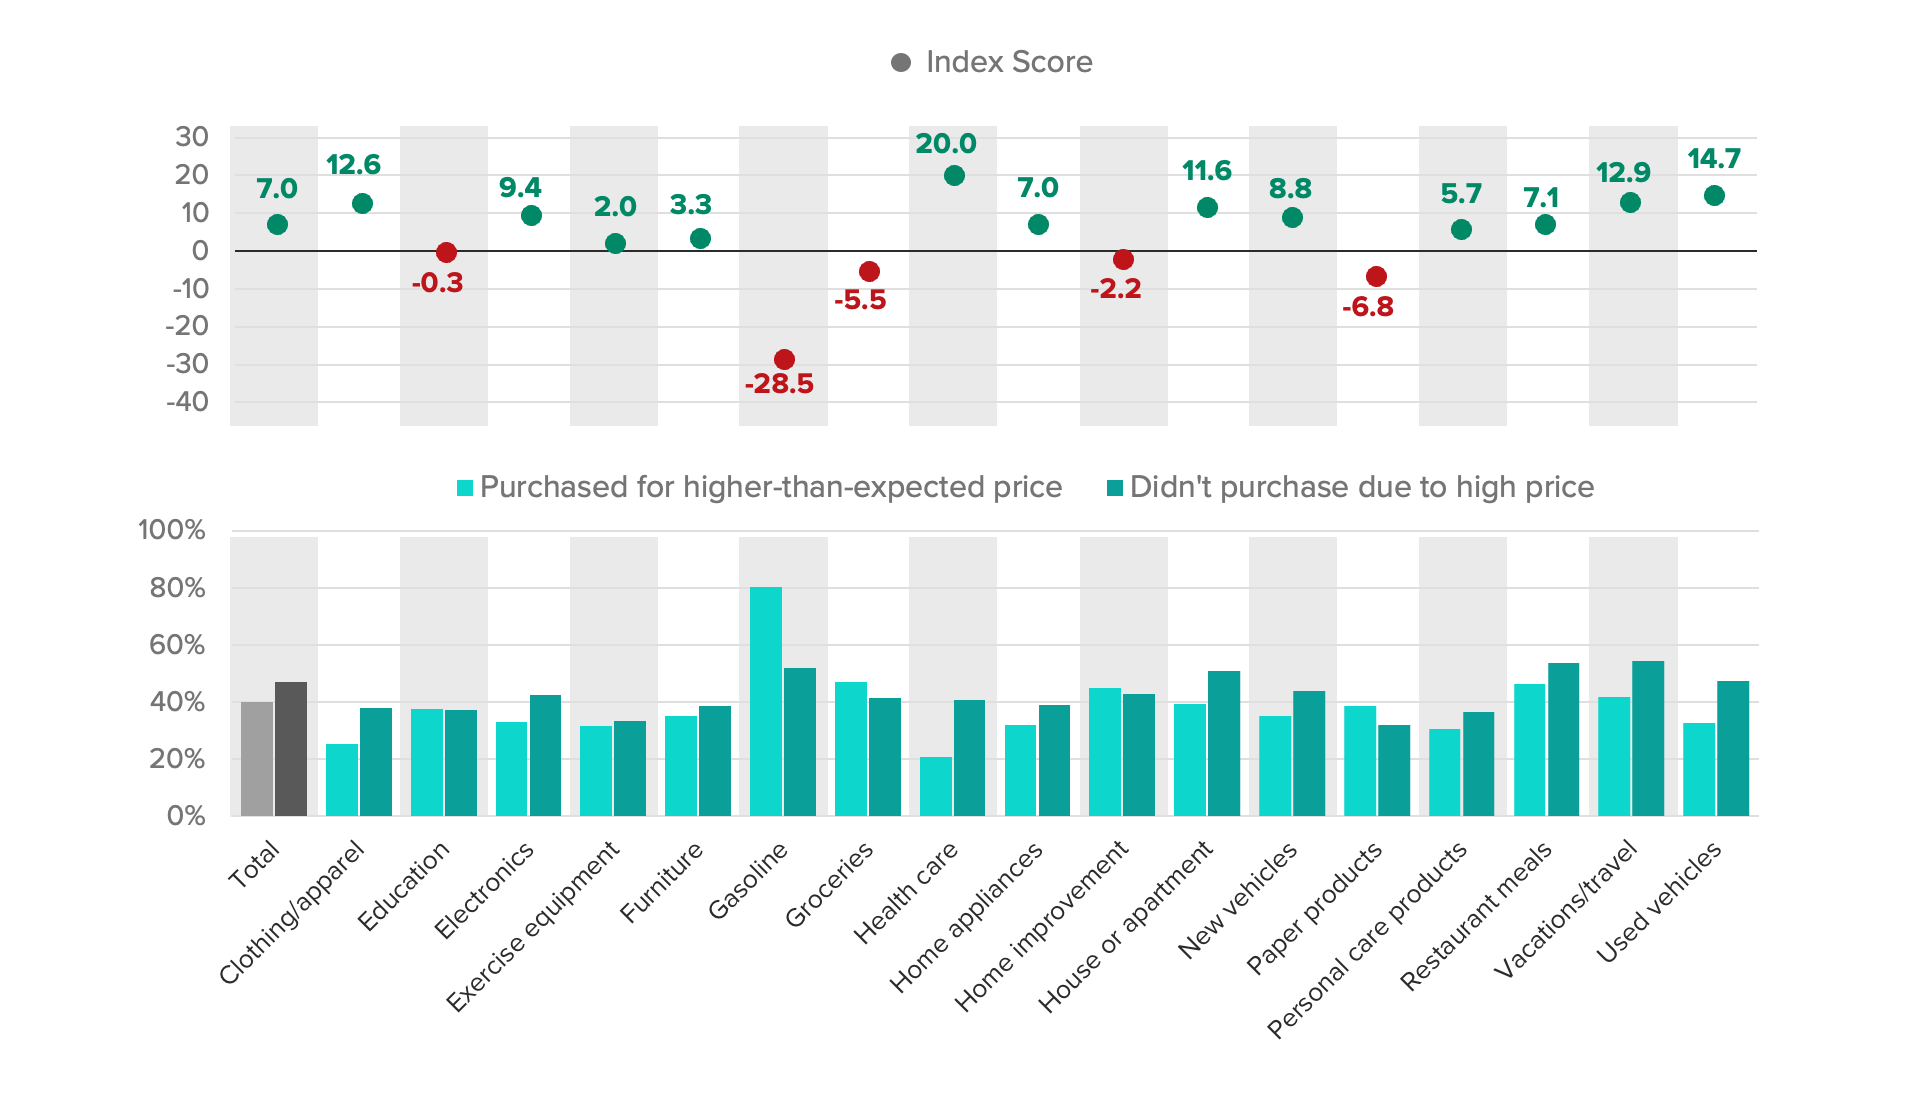
For the Price Sensitivity Index, the control purchasing behavior is the share of purchases that were completed even though the consumer encountered a higher-than-expected price, while the tested purchasing behavior is the share of consumers who walked away instead. When the share of consumers who walked away from a higher-than-expected price exceeds those who purchased anyway, the Price Sensitivity Index is positive. Conversely, when the share who purchased anyway exceeds those who walked away, the index is negative.
Inflation Pressure: Sticker Shock
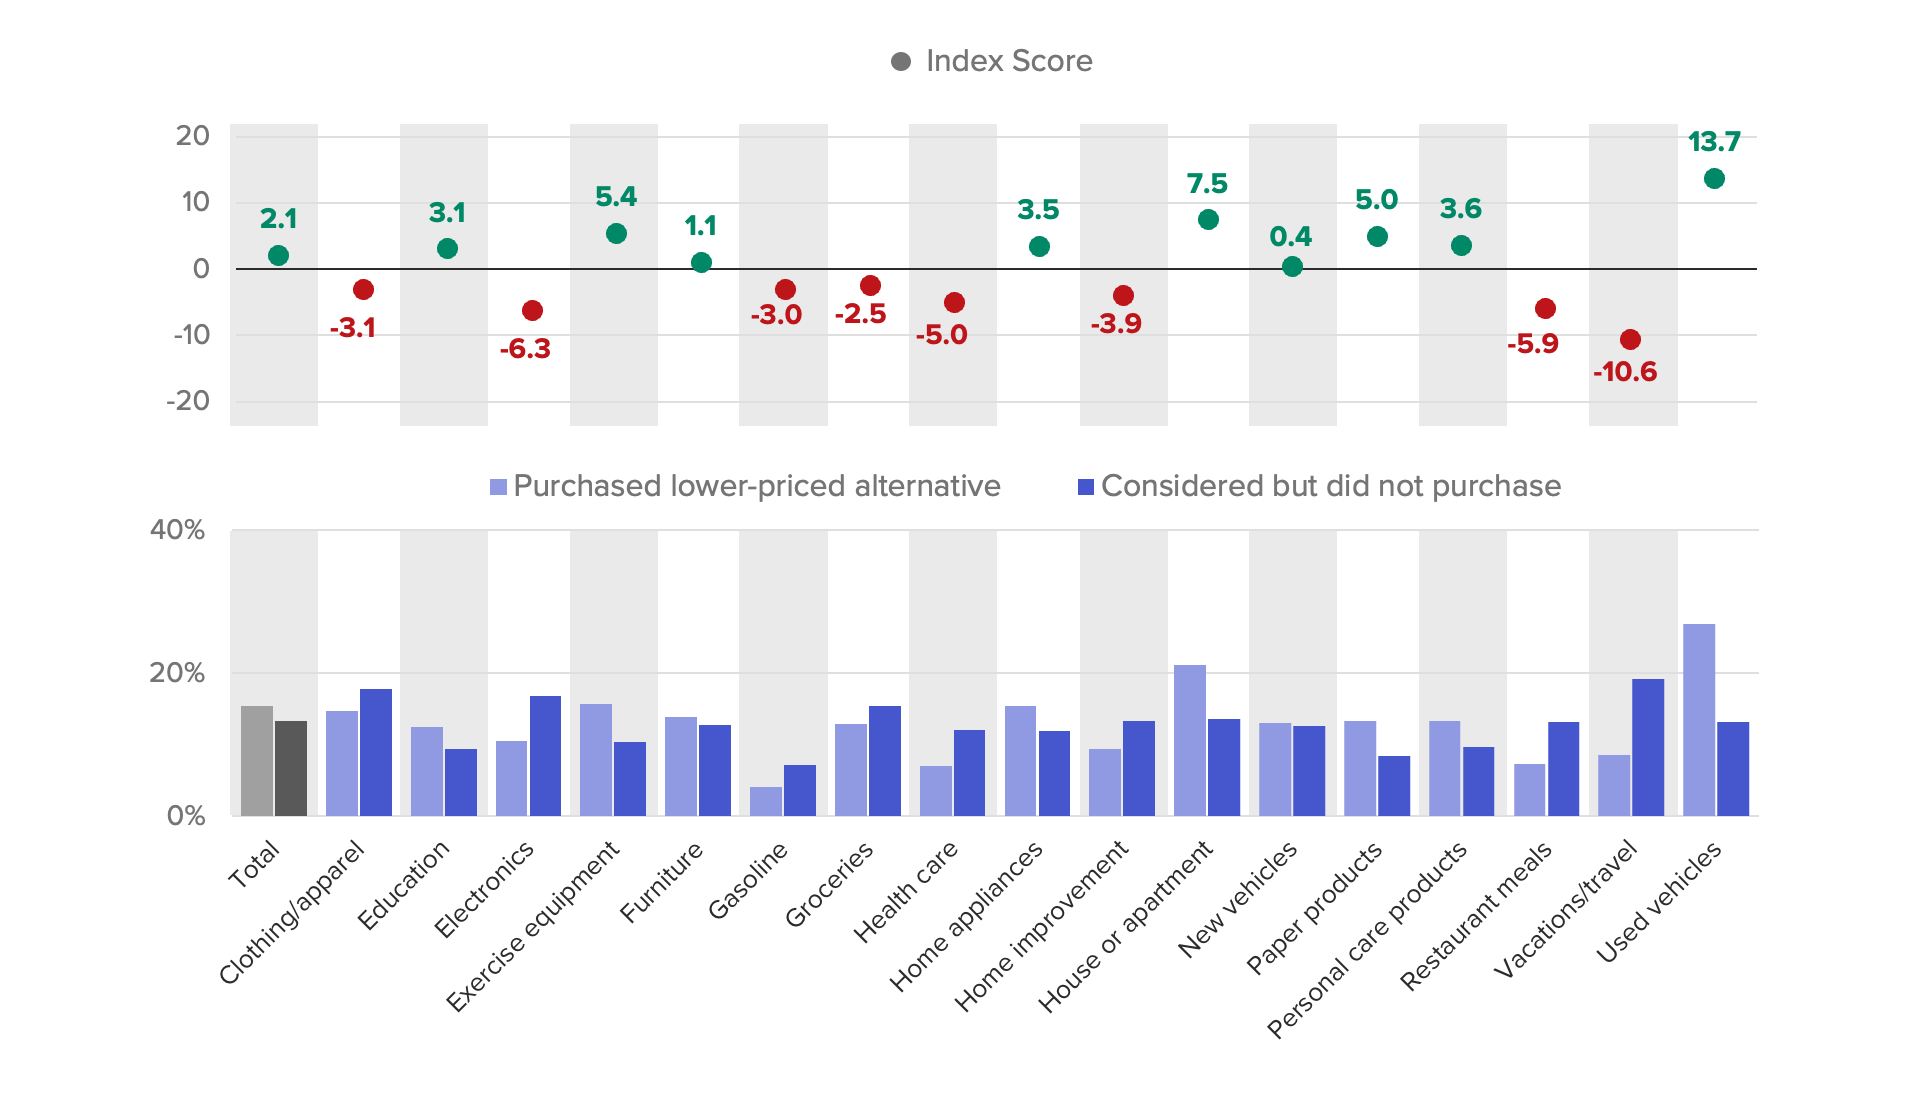
The Substitutability Index is measured in a similar way, comparing the share of potential purchases that were completed by choosing a lower-priced alternative (the tested purchasing behavior) to the share of potential purchases that were not completed (the control purchasing behavior). When the share of consumers who traded down exceeds those who did not make a purchase they were considering, the index is positive. Conversely, when the share who did not make a purchase exceeds those who traded down, the index is negative.
Inflation Pressure: Trading Down
In June, both components of the Consumer Purchasing Power Barometer pointed to rising inflationary pressures on consumer spending. However, the degree to which product-level purchasing decisions were influenced by inflation varied depending on the nature of the product or service. For some items, including large durables with resale value (such as cars or homes) or discretionary purchases (like vacations), higher prices meant fewer or smaller purchases. In other cases, especially for everyday essentials like groceries, it wasn’t possible for consumers to opt out of purchases, regardless of price. Some goods and/or services were also difficult to trade down, either because they are highly differentiated (like travel) or commoditized (like gas).
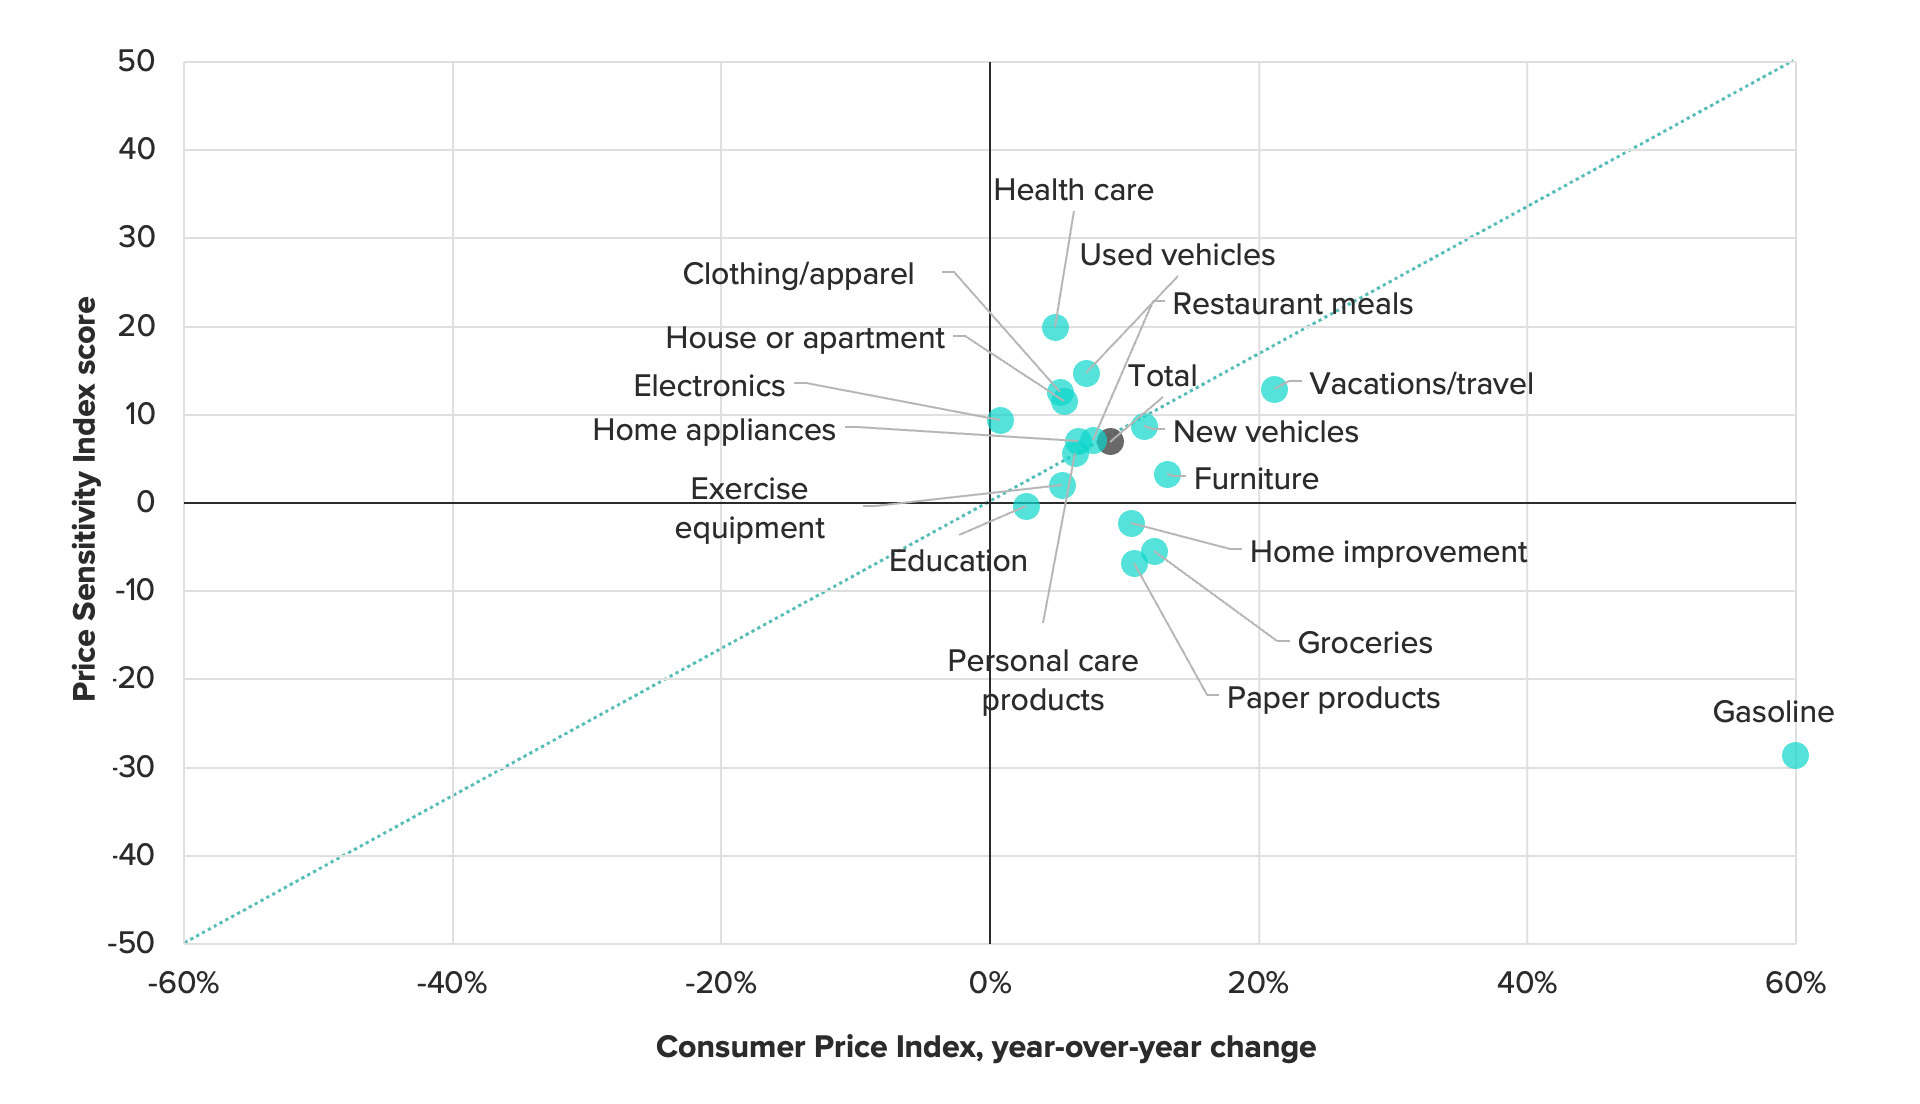
To further evaluate the relationship between consumer spending and inflation, we plotted the June category-level values for Price Sensitivity and Substitutability against the corresponding annual inflation for those goods and services. Most categories cluster around the 45-degree line in the chart for Price Sensitivity. This means that as inflation for a given category increased, the net share of consumers who walked away from a purchase because of price, compared with those who went ahead with the purchase anyway, increased by a nearly equal amount. In fact, for the total index value, the relationship is nearly one-for-one, falling almost on top of that 45-degree line.
Price Sensitivity vs. Consumer Price Inflation
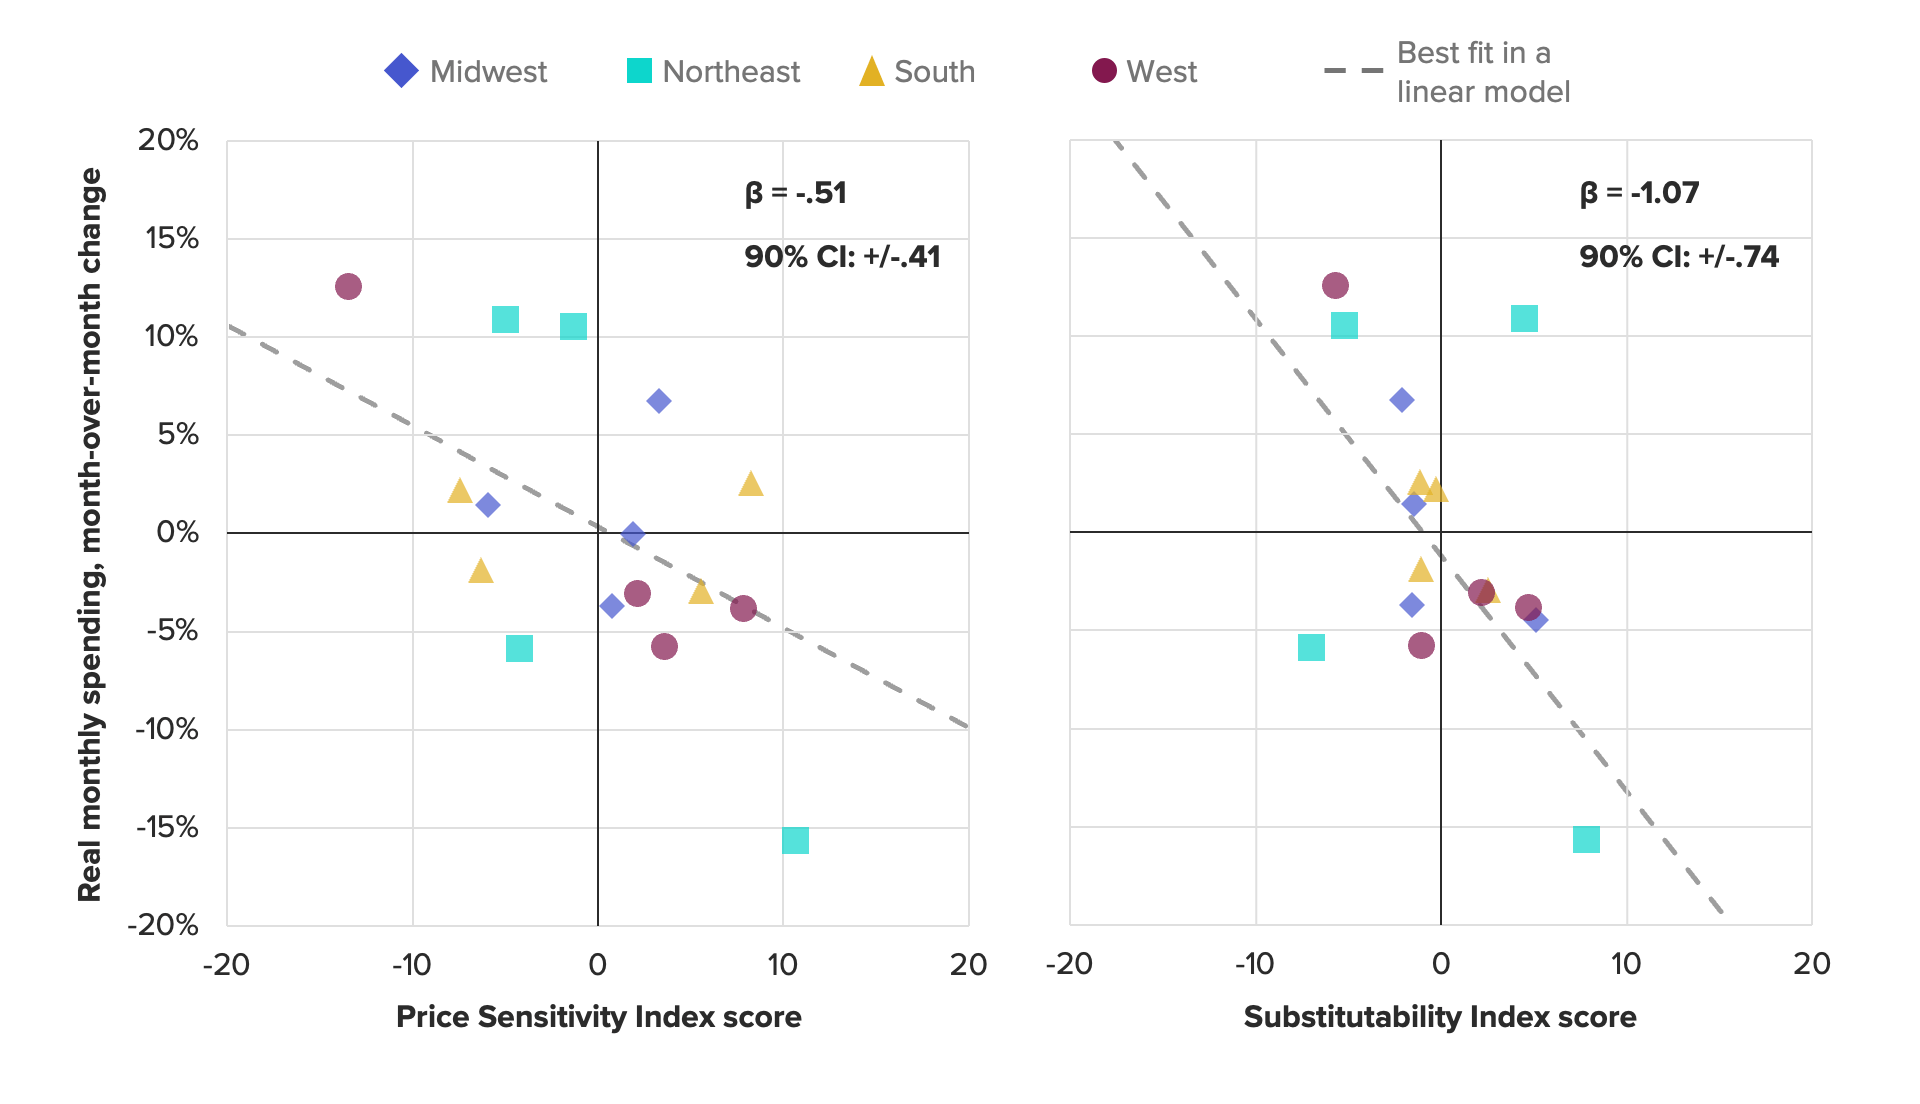
In contrast, the relationship between substitutability and inflation was less pronounced in June, with the total index value increasing about 0.5 percentage points for every 1-point increase in annual inflation. Trading down versus walking away from a purchase is often a sequential purchasing behavior. In other words, consumers may first attempt to spend less rather than not spending at all. In other cases, categories where trading down is higher are often the same ones where walking away is lower (e.g., health care, restaurants, clothing and electronics).
Substitutability vs. Consumer Price Inflation
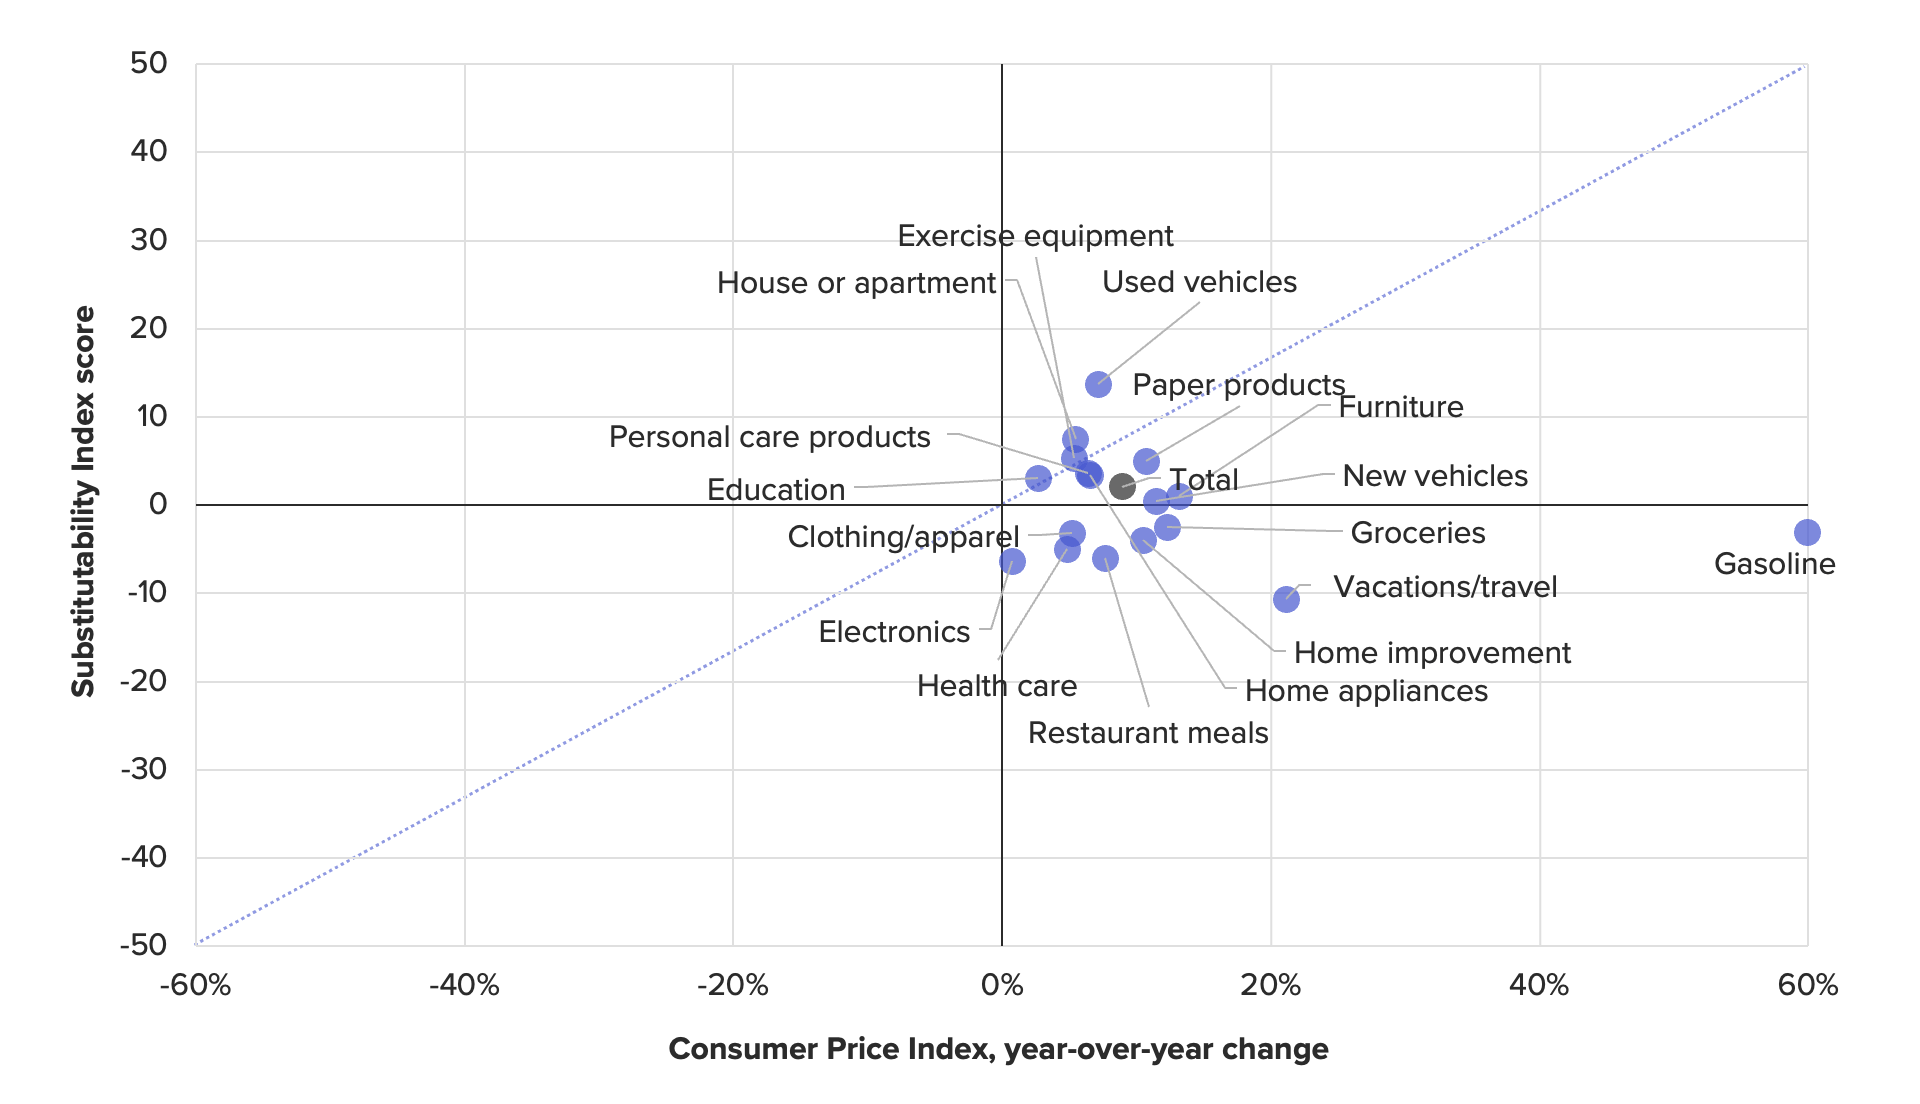
There are also clear outliers in both figures. Consistent with our previous analyses, nondurable essentials like groceries, paper products and gas exhibit lower price sensitivity. Similarly, trading down is relatively limited for gas and vacations, despite the fact that these categories experienced rapid price growth over the past year. These findings suggest that the extent to which inflation inhibits purchases in a given category or leads consumers to purchase a cheaper substitute is dependent in part on the unique characteristics of that category.
Introducing the Consumer Purchasing Power Barometer
To evaluate how the components of the CPPB relate to changes over time in consumer spending, we compared the index values of both Price Sensitivity and Substitutability with reported total monthly spending growth from Morning Consult’s Household Finances and Spending Survey. Comparable to the annual BLS Consumer Expenditure Survey, this monthly measure of household spending presents a full snapshot of the consumer wallet, capturing both new spending and debt service payments.
To account for the relatively short time series, we examined regional differences rather than the topline index values to expand the number of data points to four months of data from the four census regions. As we have seen in related work, regional differences in both inflation and consumer spending are pronounced, providing ample variation to examine. To capture regional differences in real spending growth, we inflation-adjusted the survey responses using the Consumer Price Index for the four regions. After controlling for fixed regional factors, we found strong negative effects on real spending growth from both indexes.
Price Sensitivity captures the extensive margin of spending, identifying the lost consumption due to sticker shock when consumers walk away from a purchase due to a higher-than-expected price. Substitutability, on the other hand, measures adjustment along the intensive margin of spending, capturing the trading down to cheaper substitutes that occurs when the consumer wallet is squeezed. In the reverse of what we saw above with inflation, the impact of trading down is likely to be bigger on spending, as many purchases cannot be forgone — and the effect is twice as large.
Effects of Regional Variations in Price Sensitivity and Substitutability on Consumer Spending
The above regressions provide a way to judge the relative importance of the individual components of the CPPB for changes in consumer purchasing power; the weights given to the components in a weighted average should be roughly 2-to-1 in favor of Substitutability. We used this result to create the CPPB, a single combined index of changes in consumer purchasing power, by taking a weighted average of the Price Sensitivity and Substitutability indexes and inverting it to reflect the negative relationship between inflation and spending. Whenever we observe more combined sticker shock and trading down behavior than not, the combined index will be negative. Whenever the opposite is true, the combined index will be positive.
Consumer Purchasing Power Barometer
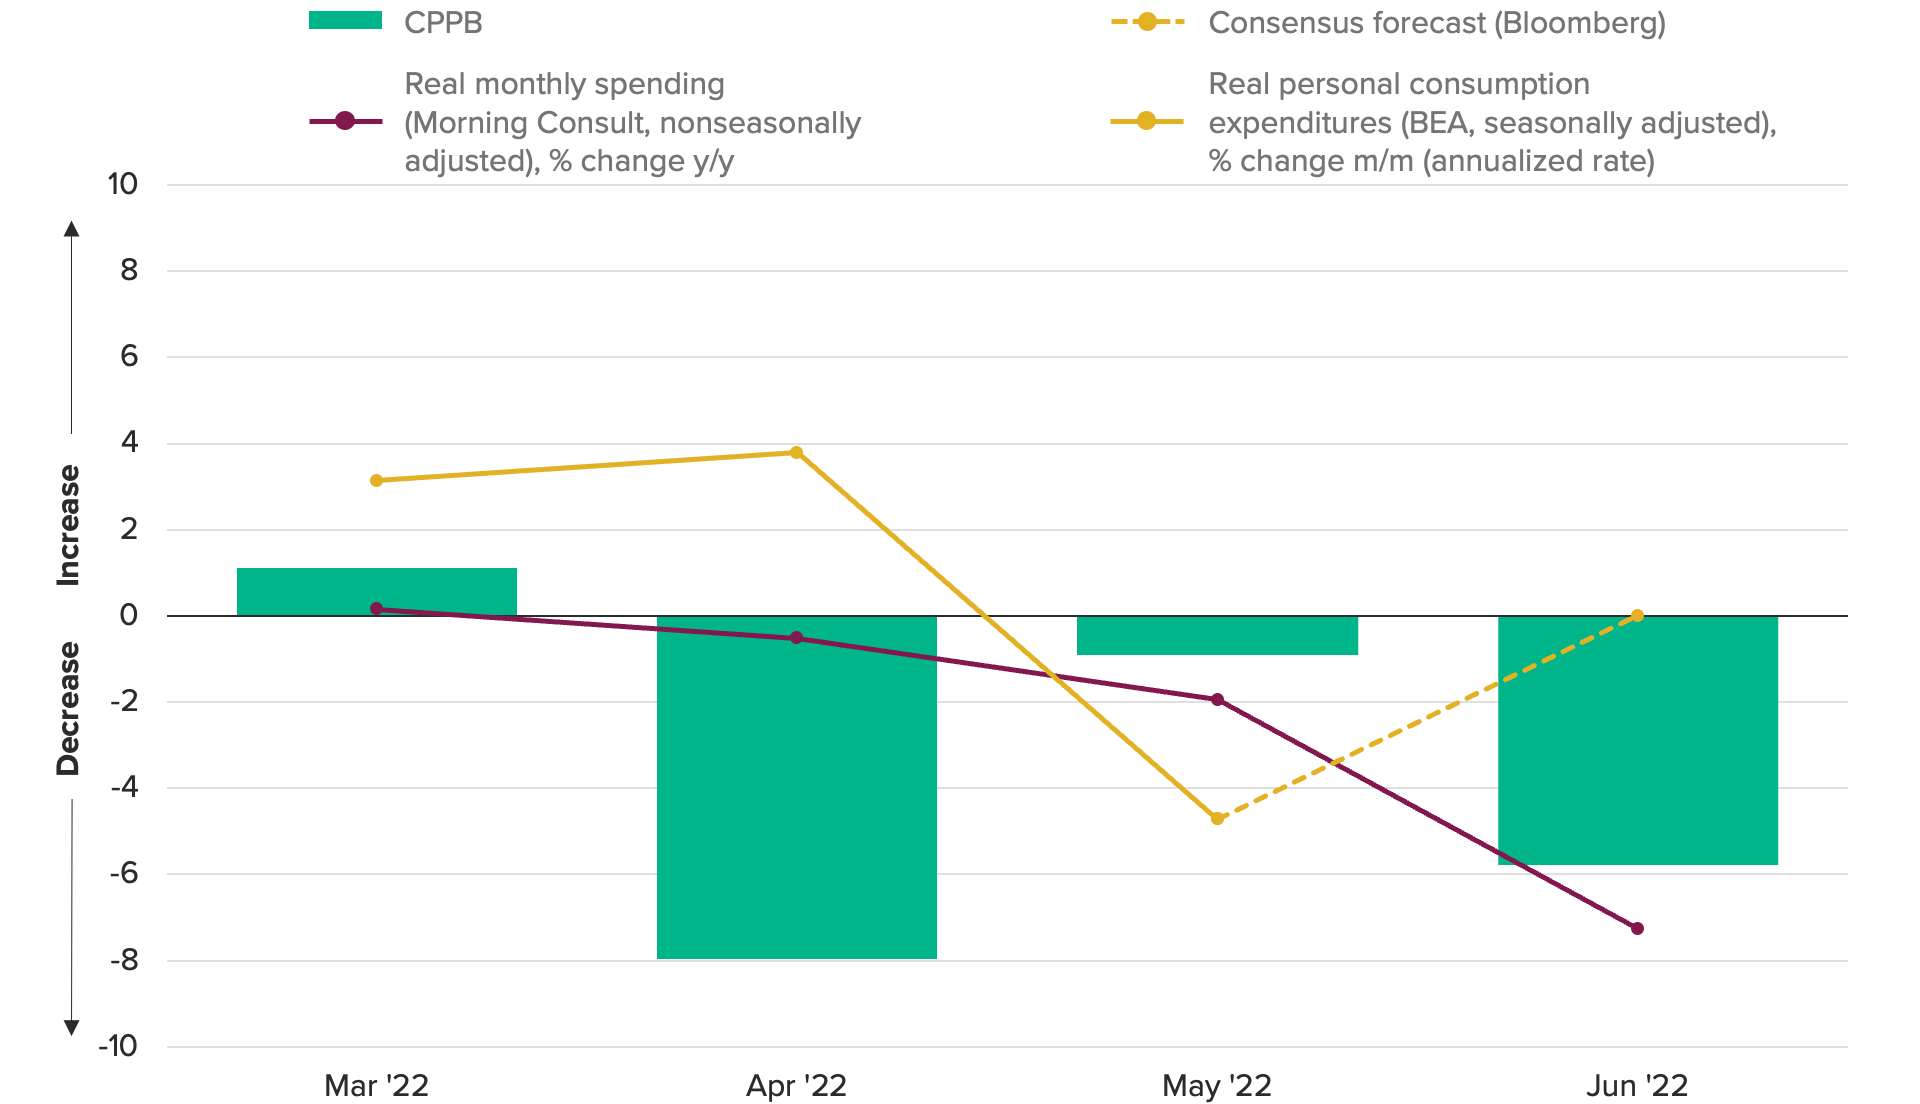
Above, we show how the CPPB has evolved over the past four months in comparison with real spending growth from our survey. Both the index and real spending have consistently deteriorated since March, with large declines in the CPPB in both April and June. For comparison, the chart also displays recent values of growth in real personal consumption expenditures from the Bureau of Economic Analysis. With real PCE also now weakening, the CPPB helps in part to explain why, providing a leading signal that consumer purchasing power is shrinking as inflation tightens its grip on the consumer wallet.
Tying together consumer spending and inflation
The combination of insights gleaned from our two surveys on consumer purchasing behavior helps to not only describe how consumers are shifting spending each month (Household Finances and Spending Survey), but also allows for further understanding of what’s driving those changes (Supply Chain and Inflation Survey). Our new Consumer Purchasing Power Barometer makes use of both surveys to provide a snapshot of consumer spending patterns and their impact on inflation-adjusted spending growth.
The timing of each survey within the month is also constructive in providing a continuous, high-frequency view of purchasing patterns. The Supply Chain and Inflation Survey fields mid-month, offering a real-time pulse of consumer psychology, while the Household Finances and Spending Survey fields immediately upon the conclusion of each month, capturing the impact of those trends on reported spending. One survey previews the other, and both are fielded and analyzed in advance of the release of personal consumer expenditures data from the Bureau of Economic Analysis for the equivalent month. Beginning in August, we will summarize both surveys in one combined Consumer Spending & Inflation report.
Kayla Bruun is the lead economist at decision intelligence company Morning Consult, where she works on descriptive and predictive analysis that leverages Morning Consult’s proprietary high-frequency economic data. Prior to joining Morning Consult, Kayla was a key member of the corporate strategy team at telecommunications company SES, where she produced market intelligence and industry analysis of mobility markets.
Kayla also served as an economist at IHS Markit, where she covered global services industries, provided price forecasts, produced written analyses and served as a subject-matter expert on client-facing consulting projects. Kayla earned a bachelor’s degree in economics from Emory University and an MBA with a certificate in nonmarket strategy from Georgetown University’s McDonough School of Business. For speaking opportunities and booking requests, please email [email protected]
Scott Brave previously worked at Morning Consult in economic analysis.