Blog
Using Effective Attention Checks in Surveys

Collecting survey data has never been easier thanks to online sample providers that can provide thousands of inexpensive responses in a very short timeframe. Collecting high-quality survey data, however, remains a problem. The online sample market is plagued with duplicate respondents, inattentive respondents, and survey fraud. At Morning Consult, we are committed to delivering high-quality data from engaged respondents. To that end, we are continuously conducting cutting-edge research to develop new methods to improve data quality.
Our comprehensive approach to identifying engaged respondents includes using a variety of attention checks. Research has shown over and over that including an attention check in a survey — or even better, several different attention checks — can effectively identify respondents who are paying insufficient attention to the survey without putting the validity of the data at risk.
Attention check examples
There are a wide variety of attention checks that vary in difficulty and directness. For example, “directed choice” questions explicitly tell respondents how to respond to the question. Consistency checks look for response combinations that are unlikely or inconsistent. Trap questions do not directly instruct the respondent how to answer but can only reasonably be answered in one way.
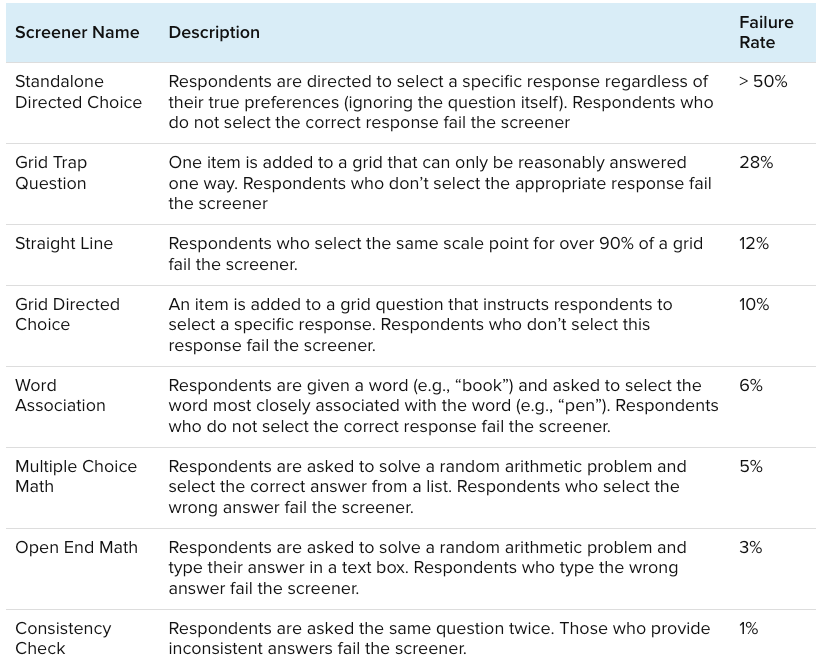
Earlier this year, the Research Science team at Morning Consult ran a study of 10,000 US adults to assess the effectiveness of 12 different attention checks that vary in difficulty and directness. The survey included several questions related to political and economic topics, along with questions about brands. Critically, we also included different attention checks at regular intervals throughout the survey. Details about the types of attention checks we included can be found in Table 1. No respondents were terminated within the survey, allowing us to estimate the relationships between different attention checks.
Which attention checks are the most difficult?
We can measure the difficulty of an attention check by calculating its failure rate, the share of respondents who answered the question in a way that might indicate dishonesty, a lack of attention, or non-compliance with instructions. In our survey, failure rates varied widely; from less than one percent to well over 50%. The study produced a few key findings related to attention check difficulty:
- Attention checks that rely on response consistency tend to have low failure rates.
- With one exception, more direct attention checks were less difficult than checks that attempted to hide the purpose of the question.For example, questions that asked respondents to solve a simple math problem or identify common word associations had failure rates between 3% and 6%, while questions that tried to trick respondents by, e.g., asking whether respondents use a fake product, had failure rates between 11% and 49%.
- Attention checks with confusing instructions may have unacceptably high failure rates. In our standalone directed choice question, respondents were first instructed to select only one item from a list. Then they were told to ignore the previous instructions and select two specific items. More than 50% of respondents failed this attention check, many of whom did select one of the items they were instructed to pick but not the other.
The wide range of failure rates across the different screeners suggests that researchers need to carefully pretest attention checks to make sure that attentive respondents understand the instructions and can complete the screener in the way the researcher expects.

Which attention checks are the most effective?
Attention checks cannot be evaluated based on their difficulty alone; after all, there is no “correct” failure rate a priori. Attention checks that are too difficult risk incorrectly flagging good respondents as inattentive, and attention checks that are too easy can lead to poor quality data that can impact a survey’s estimates.
To evaluate the effectiveness of different attention checks, we replicated the approach described by Berinsky et al (2019). This approach involves using an experiment with a well-known, often-replicated result, and comparing the results of the experiment among those who pass versus fail each attention check. In this survey, we included Tversky and Kahneman’s (1981) disease framing experiment:
Imagine that your country is preparing for the outbreak of an unusual disease, which is expected to kill 600 people. Two alternative programs to combat the disease have been proposed. Assume that the exact scientific estimates of the consequences of the programs are as follows:
(Lives Saved Frame)
“If Program A is adopted, 200 people will be saved. If Program B is adopted, there is 1/3 probability that 600 people will be saved, and 2/3 probability that no people will be saved.”
(Mortality Frame)
“If Program A is adopted, 400 people will die. If Program B is adopted there is 1/3 probability that nobody will die, and 2/3 probability that 600 people will die.”
Even though the two sets of plans are exactly the same, respondents who see the “Lives Saved” frame tend to be much more likely to select Program A, while respondents who see the “Mortality” frame tend to be more likely to select Program B. The difference between the proportion who choose program A in each frame constitutes the “treatment effect.”
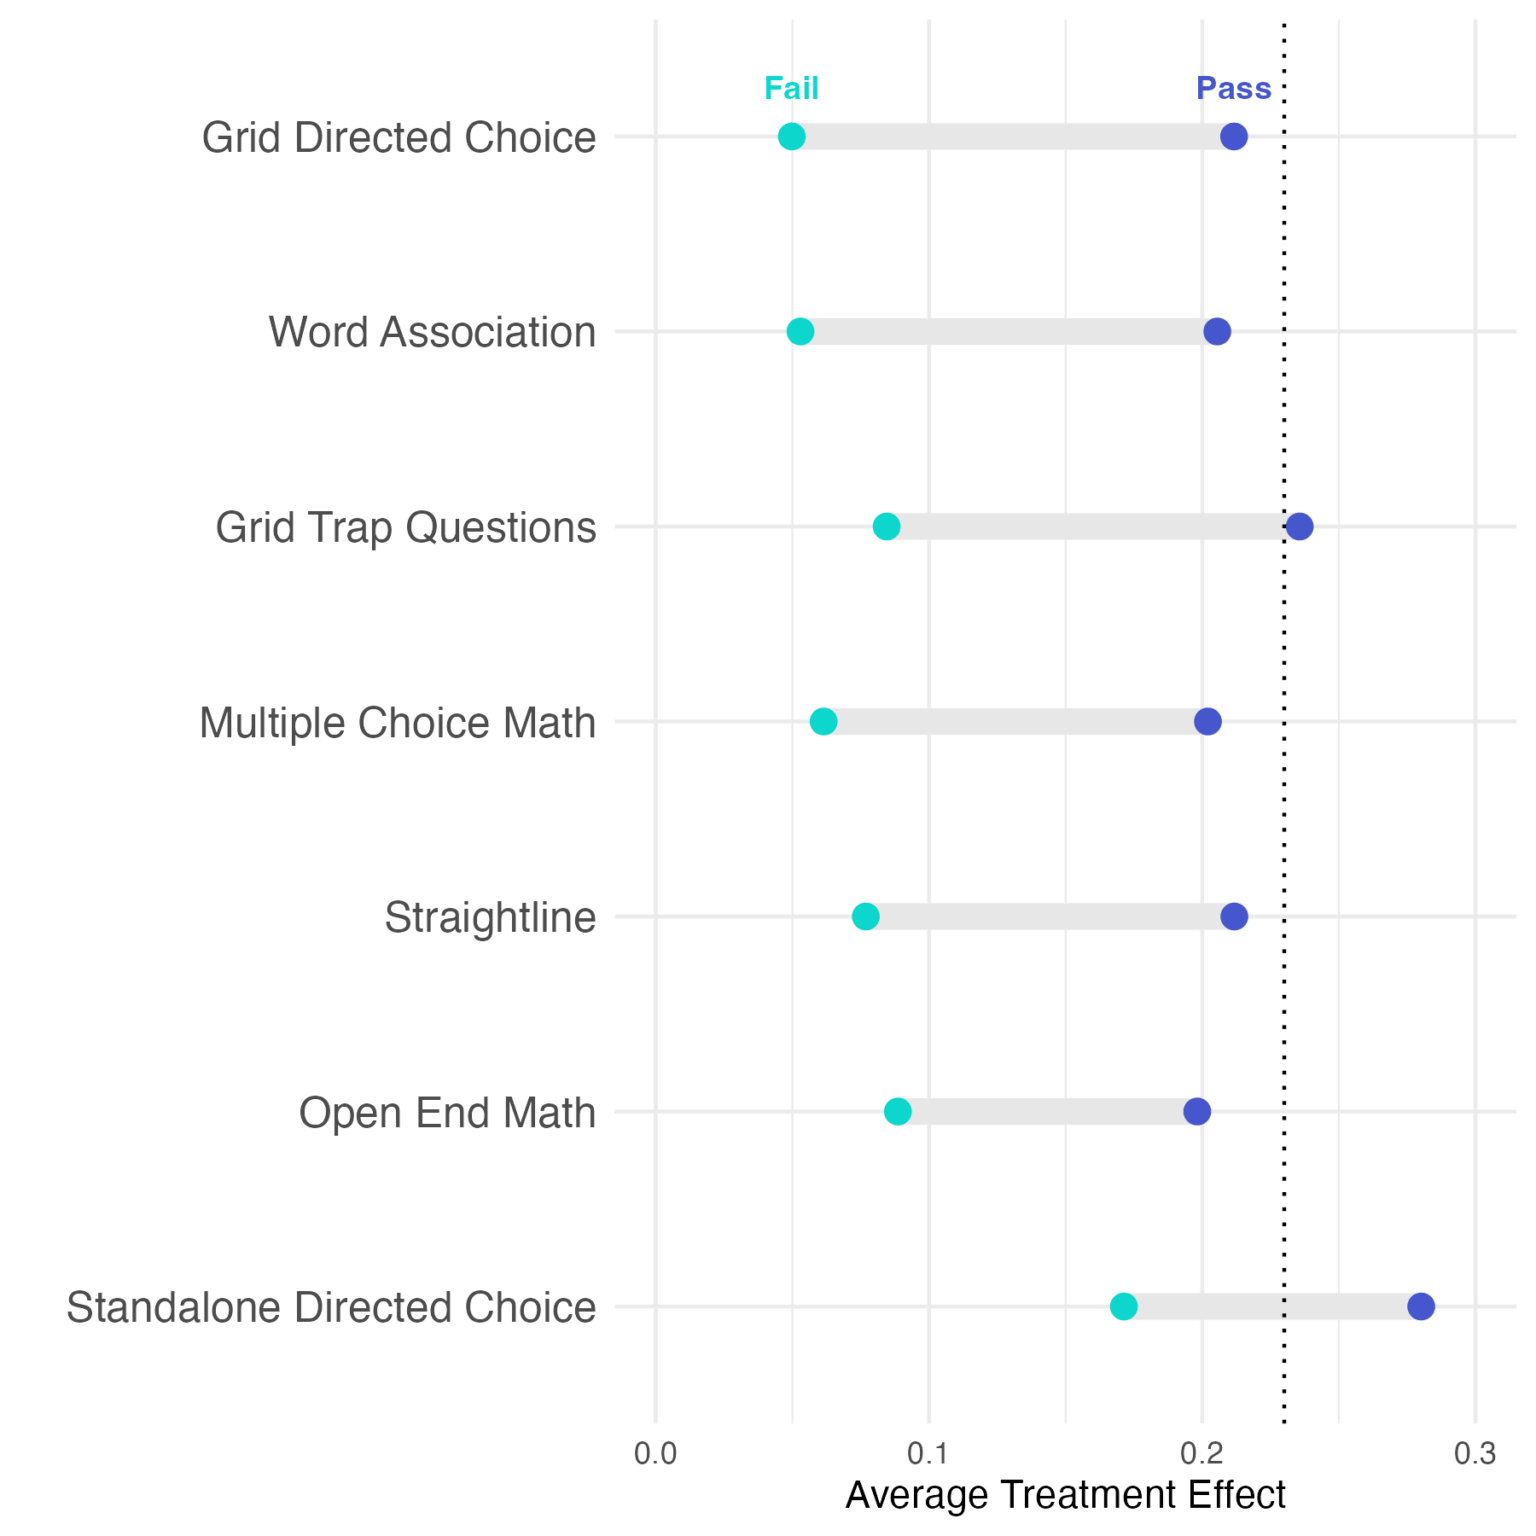
Because inattentive respondents are not likely to actually read the framing text, we do not expect them to be influenced by the framing. Instead, we expect these respondents to choose between the options quasi-randomly. As a result, we can use the treatment effect as a metric to judge the effectiveness of each screener question. An effective screener should show a very low treatment effect among respondents who failed the screener (because they are not paying attention, and therefore are not being fully treated) and a much higher treatment effect among respondents who passed the screener. We calculated the average treatment effect among respondents who passed and failed each type of screener in our survey and present the results in Figure 2.

The top-performing attention check type was the directed choice item embedded within a grid. There is a very low treatment effect among respondents who failed the screener, and quite a high treatment effect among those who passed the screener.
Interestingly, the three best-performing screeners were all different types of attention checks — one grid trap question, one directed choice grid item, and one word association task.
Some screeners appear to do an excellent job of separating “medium” attention respondents from “high” attention respondents. For example, respondents who passed “Grid Trap Question 2” were among the most attentive respondents, but some respondents who failed this screener seemed to be paying attention to the survey (see the relatively high treatment effect among failures). Even attention screeners that perform well may not be able to effectively separate attentive respondents from inattentive ones on their own. Figure 2 includes a dotted line to indicate the “expected” treatment effect based on other studies that have used this same framing experiment. With the exception of the grid trap questions and standalone directed choice item, even respondents who passed a single attention screener have a slightly lower-than-expected treatment effect. As extant research suggests, effectively identifying attentive respondents often requires a set of multiple attention checks.
Constructing an attentiveness scale
Now that we have measured the difficulty and effectiveness of each screener, we can use that information to create a scale of overall attention. The resulting score allows us to either remove respondents who fall below a given threshold or stratify our survey estimates based on attentiveness.
To construct our attentiveness scale, we start by selecting the five attention checks that do the best job of separating inattentive respondents from attentive ones. Using these five items, we could simply count the number of passed attention checks and use this count as our attention score. This additive index approach works reasonably well but gives equal weight to every screener.
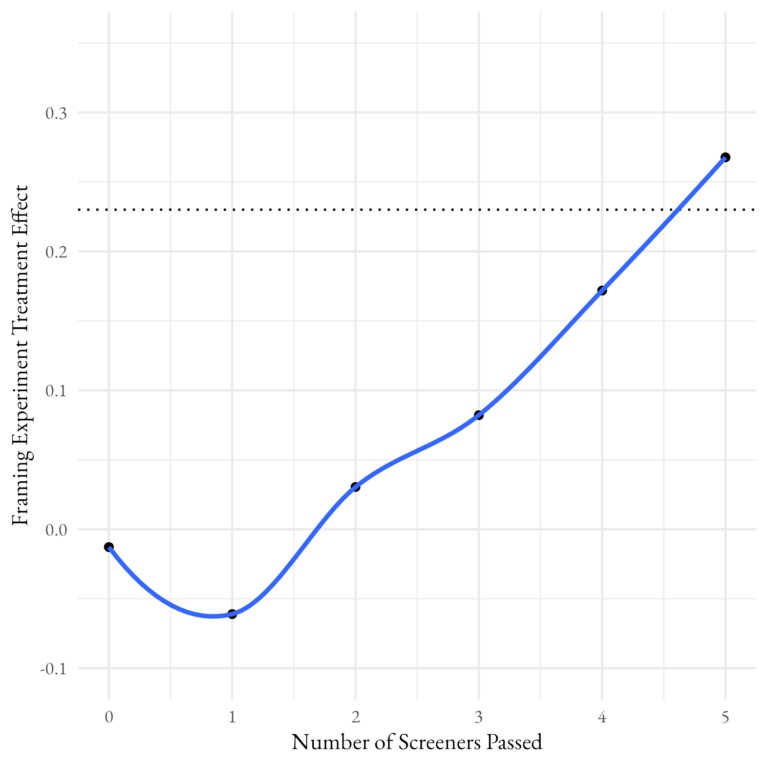
As we saw above, some screeners provide more information about overall attentiveness than others. We can incorporate this additional information in a variety of ways. Again following Berinsky et al. (2019), we use a two-parameter item response theory (IRT) model to construct latent attentiveness for each respondent based on the five top-performing attention checks. Figure 3 shows how, using either the additive index or the IRT model, respondents at the higher end of the attention scale appear to be paying more attention to the framing experiment.
Although both scales can identify attentive respondents, the IRT-derived scale does so much more efficiently. Using the simple count scale, the treatment effect only reaches the expected level among respondents who passed all five screeners. When using the IRT-derived scale, on the other hand, the top 3/5ths of the attentiveness scale reaches the expected treatment effect. Looking at the bottom of the attentiveness scale shows that even removing the bottom quintile of the attention score yields the same treatment effect as removing anyone who passed fewer than three screeners. This evidence suggests that some screeners provide much more information about attentiveness than others, and relying on a simple count ignores that crucial fact. Researchers should think carefully about adding the right attention checks and how to most effectively use the information they provide.

Attention checks help improve data quality but require care in implementation
When it comes to building a high-quality survey program, attention checks are essential. But it isn’t enough to simply add a random attention check you find online — as we’ve shown, some attention checks are more difficult to pass, even for respondents who are paying attention, and some attention checks are much better at distinguishing between attentive and inattentive respondents. Using the wrong set of attention checks risks removing good respondents from your survey and letting bad respondents through. This can seriously impact your survey results; as we’ve shown above, inattentive respondents can lead to attenuated treatment effects and introduce bias to your estimates.
James Martherus, Ph.D. is a senior research scientist at Morning Consult, focusing on online sample quality, weighting effects, and advanced analytics. He earned both his doctorate and master's degree from Vanderbilt University and his bachelor's degree from Brigham Young University.