Introducing Morning Consult’s International Spending Data

Key Takeaways
In March 2022, Morning Consult began collecting monthly consumer spending data in 14 non-U.S. markets, building on the lessons learned from our existing U.S. consumer spending data set.
Initial comparisons of spending allocations and correlations with relevant benchmarks in the U.K. and Canada are promising, though further analysis should be conducted once a longer time series is available to fine-tune methodology and implement adjustments for inflation and seasonality.
Morning Consult’s international consumer spending data will eventually enable cross-country comparisons of spending habits across 15 countries.*
*Full list of countries includes: Australia, Brazil, Canada, China, France, Germany, India, Italy, Japan, Mexico, Russia, South Korea, Spain, United Kingdom and United States.
U.S. spending data makes a case for international expansion
Morning Consult’s U.S. consumer spending data has been a useful supplement to government statistics measuring similar concepts. Since September 2020, we have collected average monthly spending levels on a selection of spending categories, replicating the Bureau of Labor Statistics’ annual Consumer Expenditures survey but at a monthly frequency. In addition to providing higher frequency per-household spending data, certain categories of Morning Consult data have registered a close correlation with government retail sales data and personal consumption expenditures data, offering a preview of what might show up in the official spending measures.
Furthermore, Morning Consult’s data offers demographic detail on spending patterns across consumer groups that is not available from other sources at a monthly frequency. This comparison of different consumer segments has proven especially interesting over the past year, enabling us to access a more nuanced understanding of how elevated inflation has affected consumers of different income levels — information that is often obscured by top-line statistics. Furthermore, the category-level detail afforded by the data set is useful for analyzing how specific groups of consumers are reallocating spending across various types of goods and services.
The multiple uses of the U.S. consumer spending data prompted the decision to expand the data set internationally. Not only can we hope to achieve a similar set of objectives within each of the additional countries, but collecting this data with a consistent survey format will also allow us to make direct comparisons of consumer spending patterns between countries. Existing spending data collection methodologies differ from country to country, making apples-to-apples comparisons based on traditional data sources more or less impossible. Morning Consult’s new data set offers a unique opportunity to more directly analyze cross-country spending patterns.
Methodology challenges with expanding internationally
We launched country-specific consumer spending surveys in March 2022, replicating the format of the pre-existing U.S. survey. While the data collection methodology is consistent across countries, there are challenges to simply applying the same data processing methodology used in the United States.
In determining the proper statistic to represent central tendency for the U.S. data, we conducted a rigorous benchmarking exercise across all categories, gauging them against government data sets. We balanced several criteria in selecting our representative spending statistic per category, including maximizing correlations with relevant time series (benchmarked to government retail sales data and personal consumption expenditures), minimizing unreasonable volatility and ensuring that overall spending allocations across categories was similar to those of the chosen benchmark series (in this case, the BLS’ Consumer Expenditures survey).
The resulting statistics chosen through this process are all trimmed means, but the sizes of the trims vary depending on category-specific characteristics. For the sake of consistency, we limited our options to 1%, 2.5%, 5% and 10% trims at the low and high end of the distribution. In general, we faced a trade-off: It is desirable to trim as little as possible to avoid discarding useful outliers, but trimming too little runs the risk of introducing excess noise. For instance, categories that register infrequent purchases (such as airline fares) faced excess volatility from month to month when trims were too small, due to the disproportionate impact of outliers in these cases. Conversely, categories such as groceries effectively had larger sample sizes in terms of the number of monthly purchasers and could better absorb the variation introduced by smaller trims.
Given the degree to which category-level idiosyncrasies affected optimal trims in the U.S. data, it is reasonable to assume country-level differences could also lead to different optimal trims than those in the United States. Furthermore, the international data is being collected from a smaller sample (1,000 respondents monthly vs. 2,200 in the United States), adding to the likelihood that the U.S. methodology would need to be refined in order to apply it with maximum effectiveness to other countries.
Benchmarking to official statistics for data validation and methodology selection
Rather than simply applying the U.S. methodology to the international data, we instead sought to replicate the methodology determination process for each country.
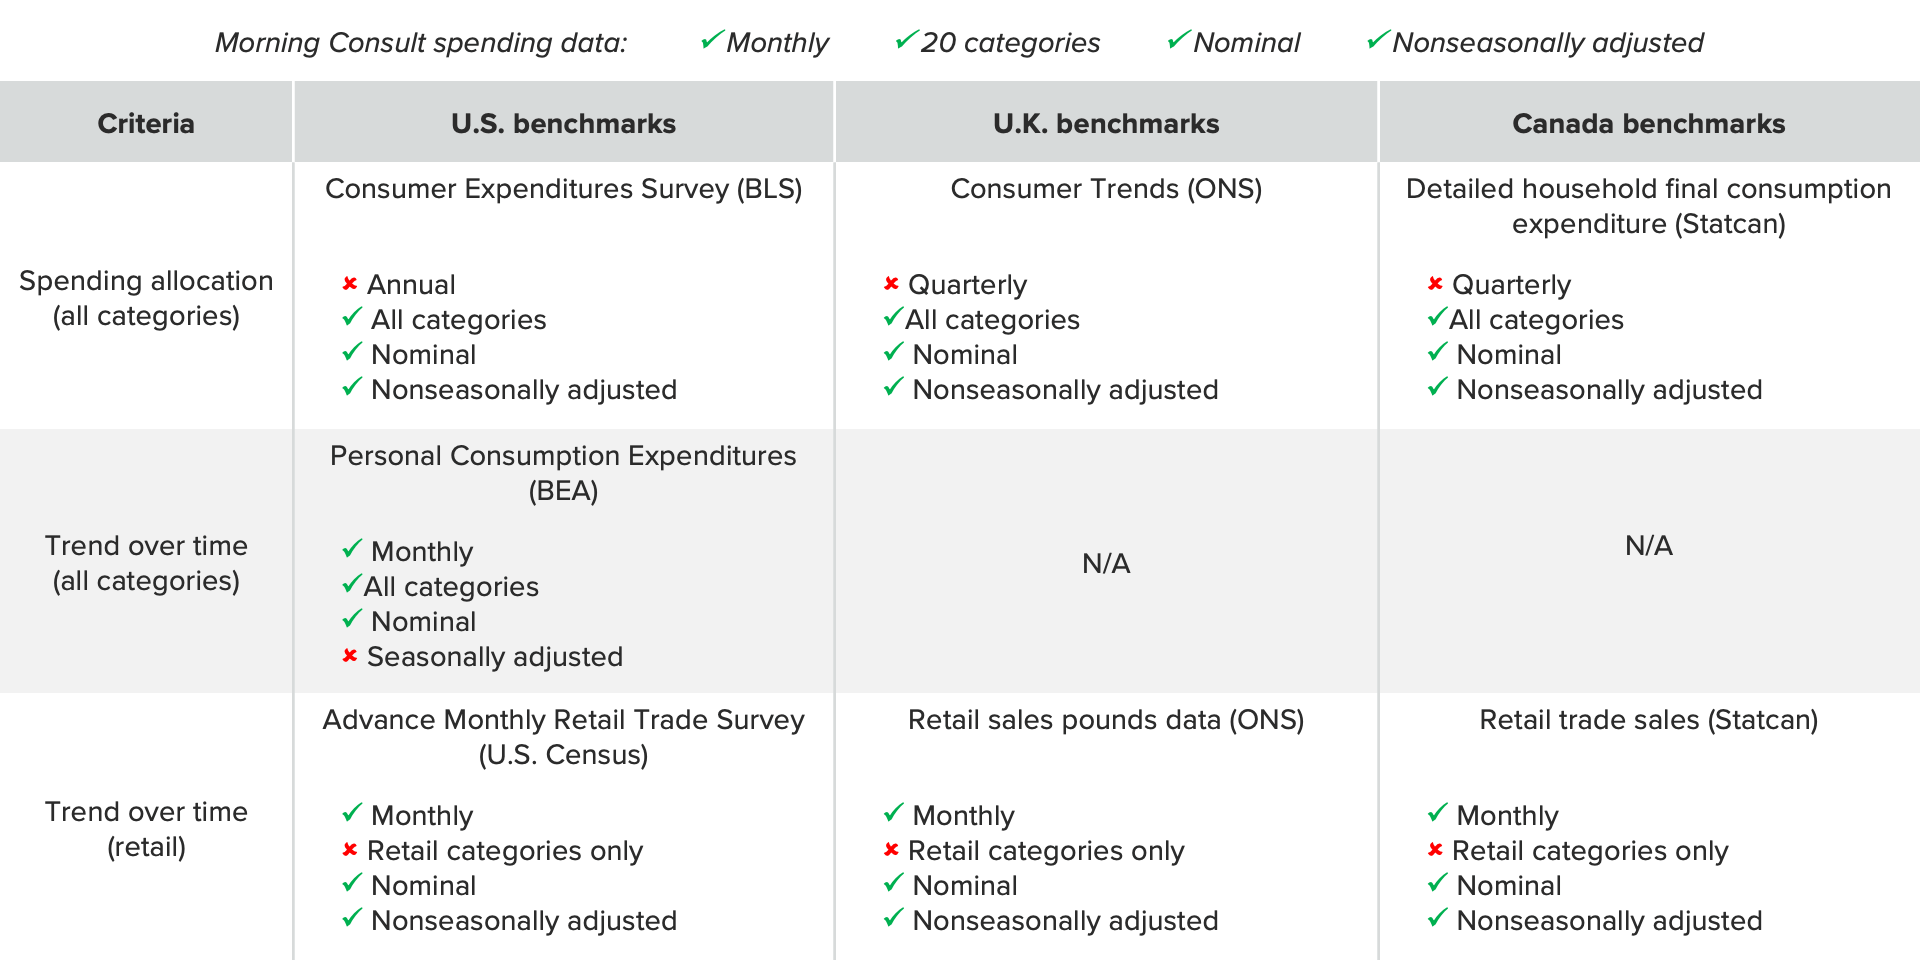
To do this, we needed to identify official spending statistics from each country to benchmark our own data against. An ideal benchmark would match the time frame, category coverage and frequency of our proprietary data, and would be available nominally and nonseasonally adjusted. Unfortunately, official data sets matching all of these criteria for each country do not exist. Several of the 14 countries in our expanded coverage have almost no relevant benchmarks available — a fact that reinforces the potential value of our survey, but makes it difficult to validate it against official sources.
We decided to start the validation process with countries that possess the strongest available benchmarks. The U.K. and Canada each have quarterly, category-level spending data that overlaps the time period for our survey, as well as monthly data for a subset of retail categories. In both cases, the benchmark data sets represent aggregate spending levels, while Morning Consult’s data represents average reported spending per household. Comparisons must therefore be based on relative shares (i.e., spending allocation across categories for a single point in time) or percentage changes over time rather than actual spending levels.
We used the selected combination of benchmarks to choose appropriate trims per spending category in the following ways: Using the quarterly series, we chose trimmed means that maximized the correlation between Morning Consult’s spending allocation and that of the benchmark series —in other words, ensuring that the share of wallet appeared consistent with the benchmark. For the subset of retail categories that also had an available benchmark with a monthly frequency, we chose trims that maximized the correlation between each series’ monthly change over time.
Selecting appropriate trims
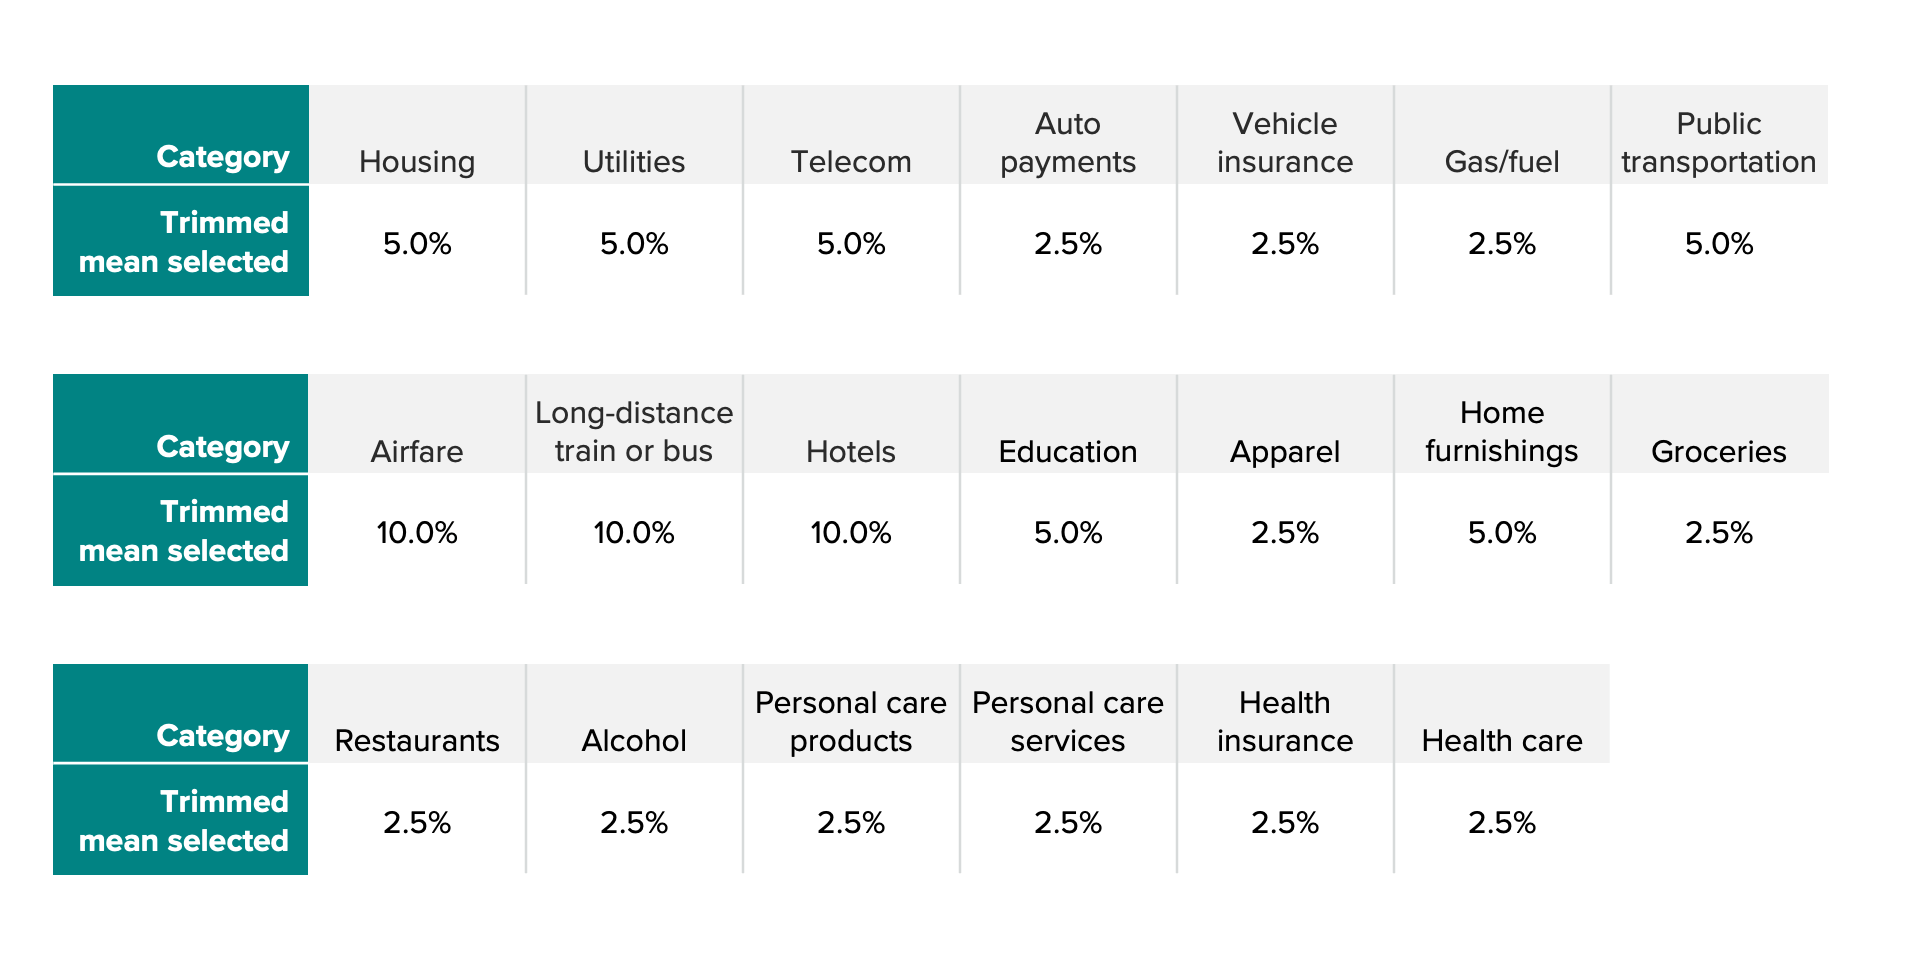
As was done in the United States, trim selection per category balanced a variety of factors. Our primary objective was to maximize spending allocation correlation with that of the chosen benchmark series. As a secondary criteria, for categories with monthly time series benchmarks — i.e., retail items — we also aimed to select trims that resulted in high correlations between percentage changes over time. Finally, eliminating excess volatility was also a consideration.
With this in mind, the resulting trims tended to follow a pattern: Categories with fewer buyers each month tended to have larger trims, smoothing out noisy outliers that disrupted relationships with benchmarks, while the most frequently purchased categories tended to have more modest trims. In cases where trim size had a negligible effect on relationships with benchmarks in one country, we opted to match the chosen trim for that category in the other country for the sake of consistency. Generally, similar spending patterns in these economies enabled uniform trim choices across both countries.
Trims applied on either side of Morning Consult’s category-level response data
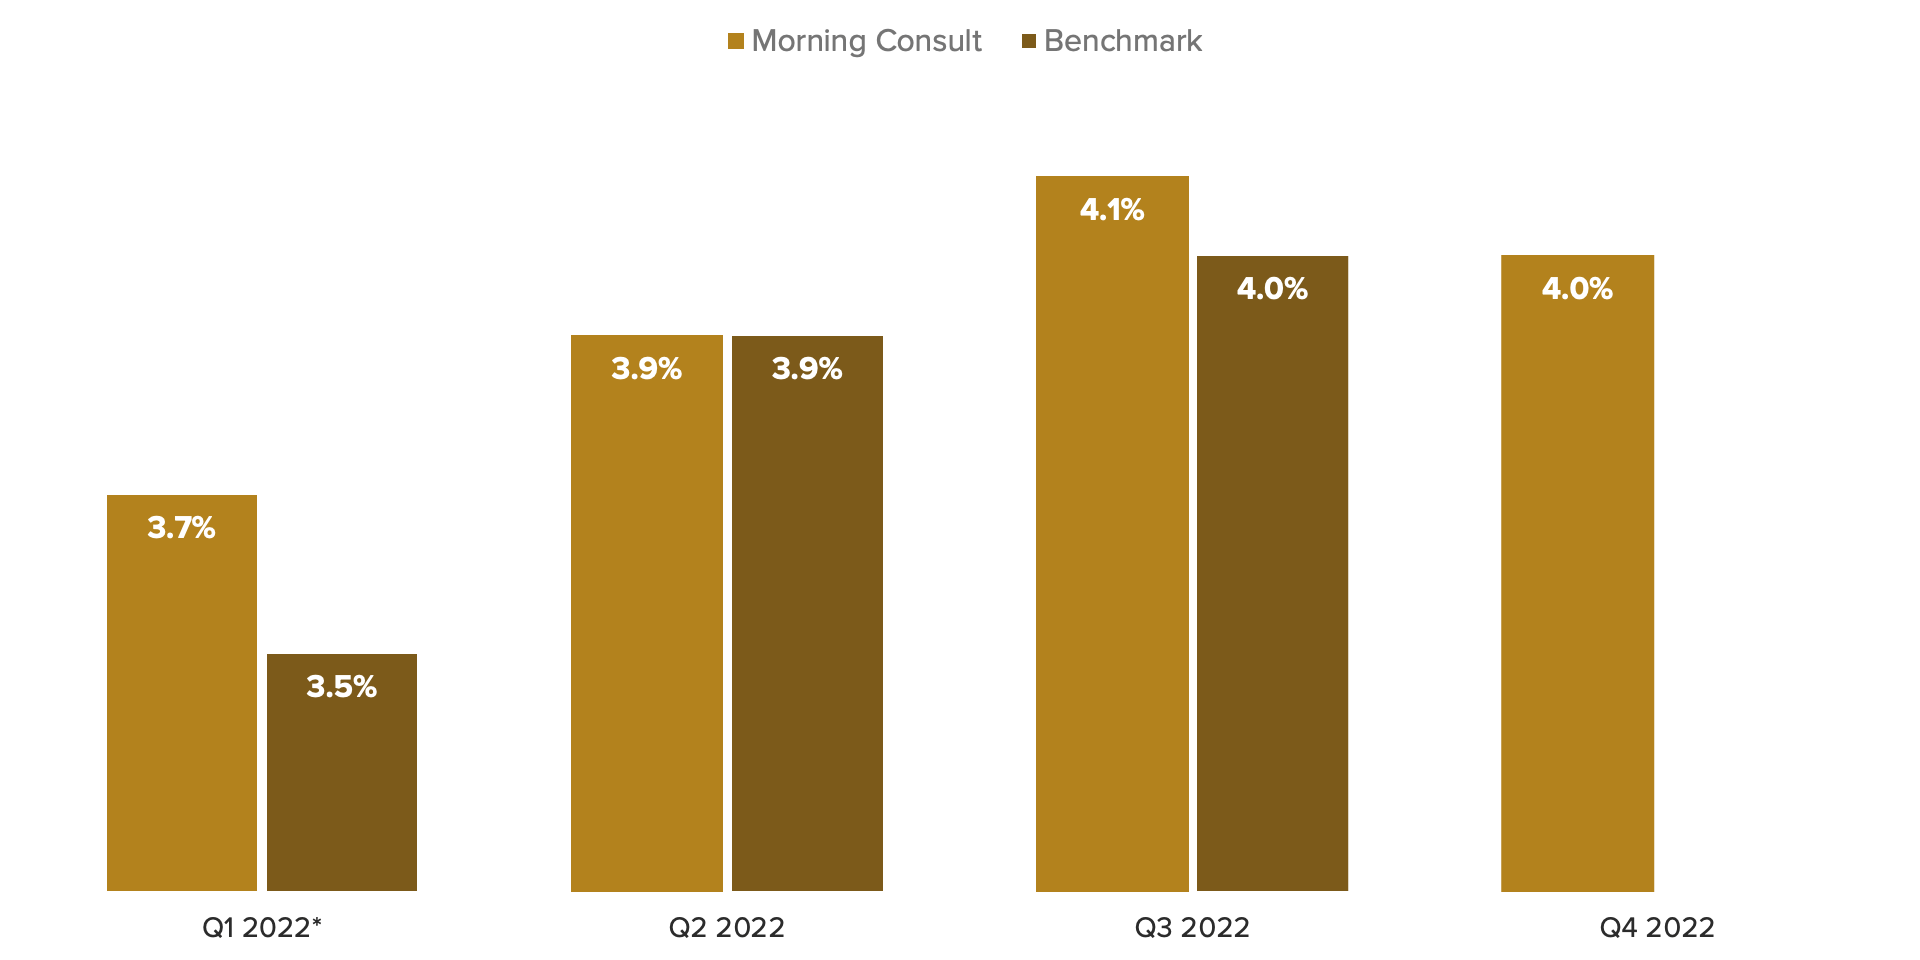
The correlations between Morning Consult’s spending allocations and the relevant benchmark’s category spending allocations for each country were quite high regardless of trim selection, with all tested combinations yielding correlations above .90. The chosen set of trims maximized allocation correlations with scores of .94 and.97 in the U.K. and Canada, respectively.
The variation in certain categories could be the result of comparing averages against aggregate spending levels. Morning Consult’s focus on central tendency is more likely to be biased toward the “average consumer,” whereas aggregate levels tracked by the benchmarks by design include the impacts of high-end outliers. For example, the U.K. and Canada benchmark data sets showed a higher share of wallet allocated to discretionary categories such as restaurant spending (part of the “food” category), apparel and home furnishings, and a lower share of wallet allocated to staple services like housing and utilities. Higher-income consumers with large discretionary budgets could be contributing a larger boost to aggregate spending for categories that make up a more modest share of budgets for the “everyday consumer” captured by Morning Consult’s data.
While the quarterly cadence offered limited opportunity for time series comparisons, certain anecdotal insights could be gleaned from this process as well. For instance, the U.K. spent much of 2022 grappling with rising fuel costs, and the increasing share of this component in consumer budgets was clearly visible in the spending data from both Morning Consult and the official benchmark series.
Exploring time series relationship with retail spending
In the United States, Morning Consult’s spending data has been a useful predictor of monthly retail sales. It is reasonable to hope that a similar use case could be explored in the U.K. and Canada. Both of these countries’ statistical agencies offer monthly retail sales data, enabling time series comparisons for a subset of spending categories (albeit for a relatively short period of time so far).
In both the United States and globally, there are challenges in comparing Morning Consult’s spending data to retail sales data that we anticipate would lead to differing results. Government retail surveys typically measure aggregate sales that are categorized by type of store. Morning Consult’s data measures average spending levels per household categorized by type of product or service. Despite these differences, our experience with Morning Consult’s U.S. spending data suggests that retail sales data and consumer spending data should exhibit similar trends at some aggregate level.
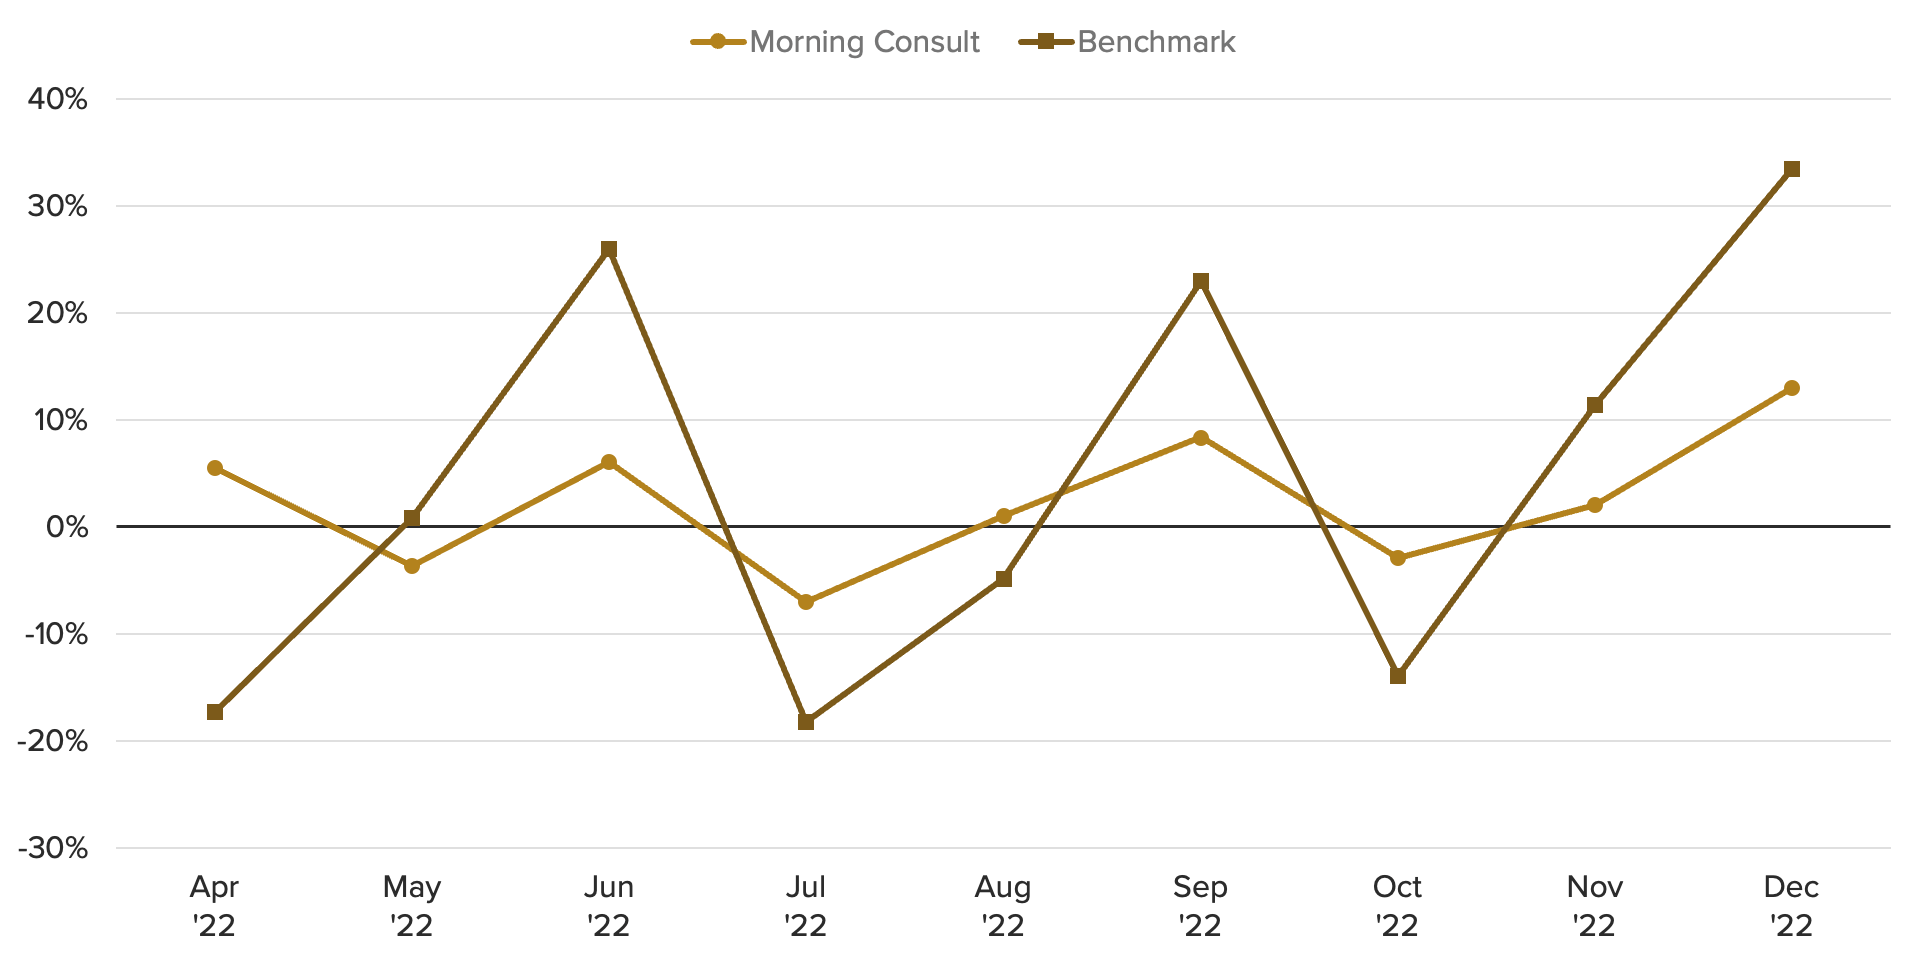
From April through December, an aggregate measure of the Morning Consult categories that most closely compare to retail categories found in the U.K Office for National Statistics’ retail survey was strongly correlated with both top-line retail sales and the subset of matched categories — namely alcohol, apparel, gas, groceries, home furnishings, personal care products and telecom. The resulting correlation was .84 during this period.
In Canada, from April through December, the correlation was moderately positive (.45) but less strong. However, much of this variation appears to be driven primarily by differences in timing for the auto category: Retailers (captured by the benchmark) might record auto revenue at the time of sale, but consumers (captured by Morning Consult’s data) in many cases finance these purchases and pay in installments over a longer period. Excluding the auto category, the correlation over time was much higher (.71). These time series relationships should be monitored in the long term, but preliminary findings suggest that Morning Consult’s spending data appears to relate relatively well with retail sales for the categories that would be expected to move in alignment.
Next steps for expanded international coverage & deeper insights on global spending patterns
The initial benchmarking exercise for the U.K. and Canada offered promising results, with Morning Consult’s spending data in each country showing robust relationships with official spending statistics over the period being evaluated. Furthermore, the trim selection process provided useful insights that can be applied to subsequent validation efforts regarding the additional 12 countries for which data is being collected. For instance, the relationship between the quantity of monthly buyers and appropriate trim size per category could provide a useful rule of thumb for selecting measures of central tendency for countries where benchmarking information is scarce.
In the coming months, we plan to apply the lessons learned so far to the remaining 12 countries in our data set. Once methodologies are established for the full roster of geographies, our international spending data can be used to analyze country-specific trends and draw cross-country comparisons. Demographic and category-level detail within countries enables an even deeper level of analysis, comparable to that exhibited in our ongoing U.S. coverage.
The relatively short history of our international spending data does confer limitations: We will likely need to revisit the benchmarking exercise in the future when more time series data has been collected to ensure the selected methodology remains robust over time. Furthermore, to maximize the relevance of the data set, we will eventually want to implement inflation and seasonality adjustments as we have done with the U.S. data.
In the near term, however, the prospect of a complete data set of comprehensive, category-level spending data with consistent coverage across 15 major economies — available at both the top-line level and broken out by demographic — offers exciting possibilities for gaining a deeper understanding of consumer purchasing behavior around the world.
Kayla Bruun is the lead economist at decision intelligence company Morning Consult, where she works on descriptive and predictive analysis that leverages Morning Consult’s proprietary high-frequency economic data. Prior to joining Morning Consult, Kayla was a key member of the corporate strategy team at telecommunications company SES, where she produced market intelligence and industry analysis of mobility markets.
Kayla also served as an economist at IHS Markit, where she covered global services industries, provided price forecasts, produced written analyses and served as a subject-matter expert on client-facing consulting projects. Kayla earned a bachelor’s degree in economics from Emory University and an MBA with a certificate in nonmarket strategy from Georgetown University’s McDonough School of Business. For speaking opportunities and booking requests, please email [email protected]
Sofia Baig is an economist at decision intelligence company Morning Consult, where she works on descriptive and predictive analysis that leverages Morning Consult’s proprietary high-frequency data. Previously, she worked for the Federal Reserve Board as a quantitative analyst, focusing on topics related to monetary policy and bank stress testing. She received a bachelor’s degree in economics from Pomona College and a master’s degree in mathematics and statistics from Georgetown University.
Follow her on Twitter @_SofiaBaig_For speaking opportunities and booking requests, please email [email protected]