Interpreting Morning Consult’s Supply Chain Indexes of Consumer Inflation Pressures

This note provides a brief summary of how to interpret the five indexes that comprise our Supply Chain Indexes of Consumer Inflation Pressures. Below, we discuss both how to interpret the concepts tracked by the indexes and the index scores themselves. Additional information can be found in the U.S. Supply Chains and Inflation report and its accompanying methodological note.
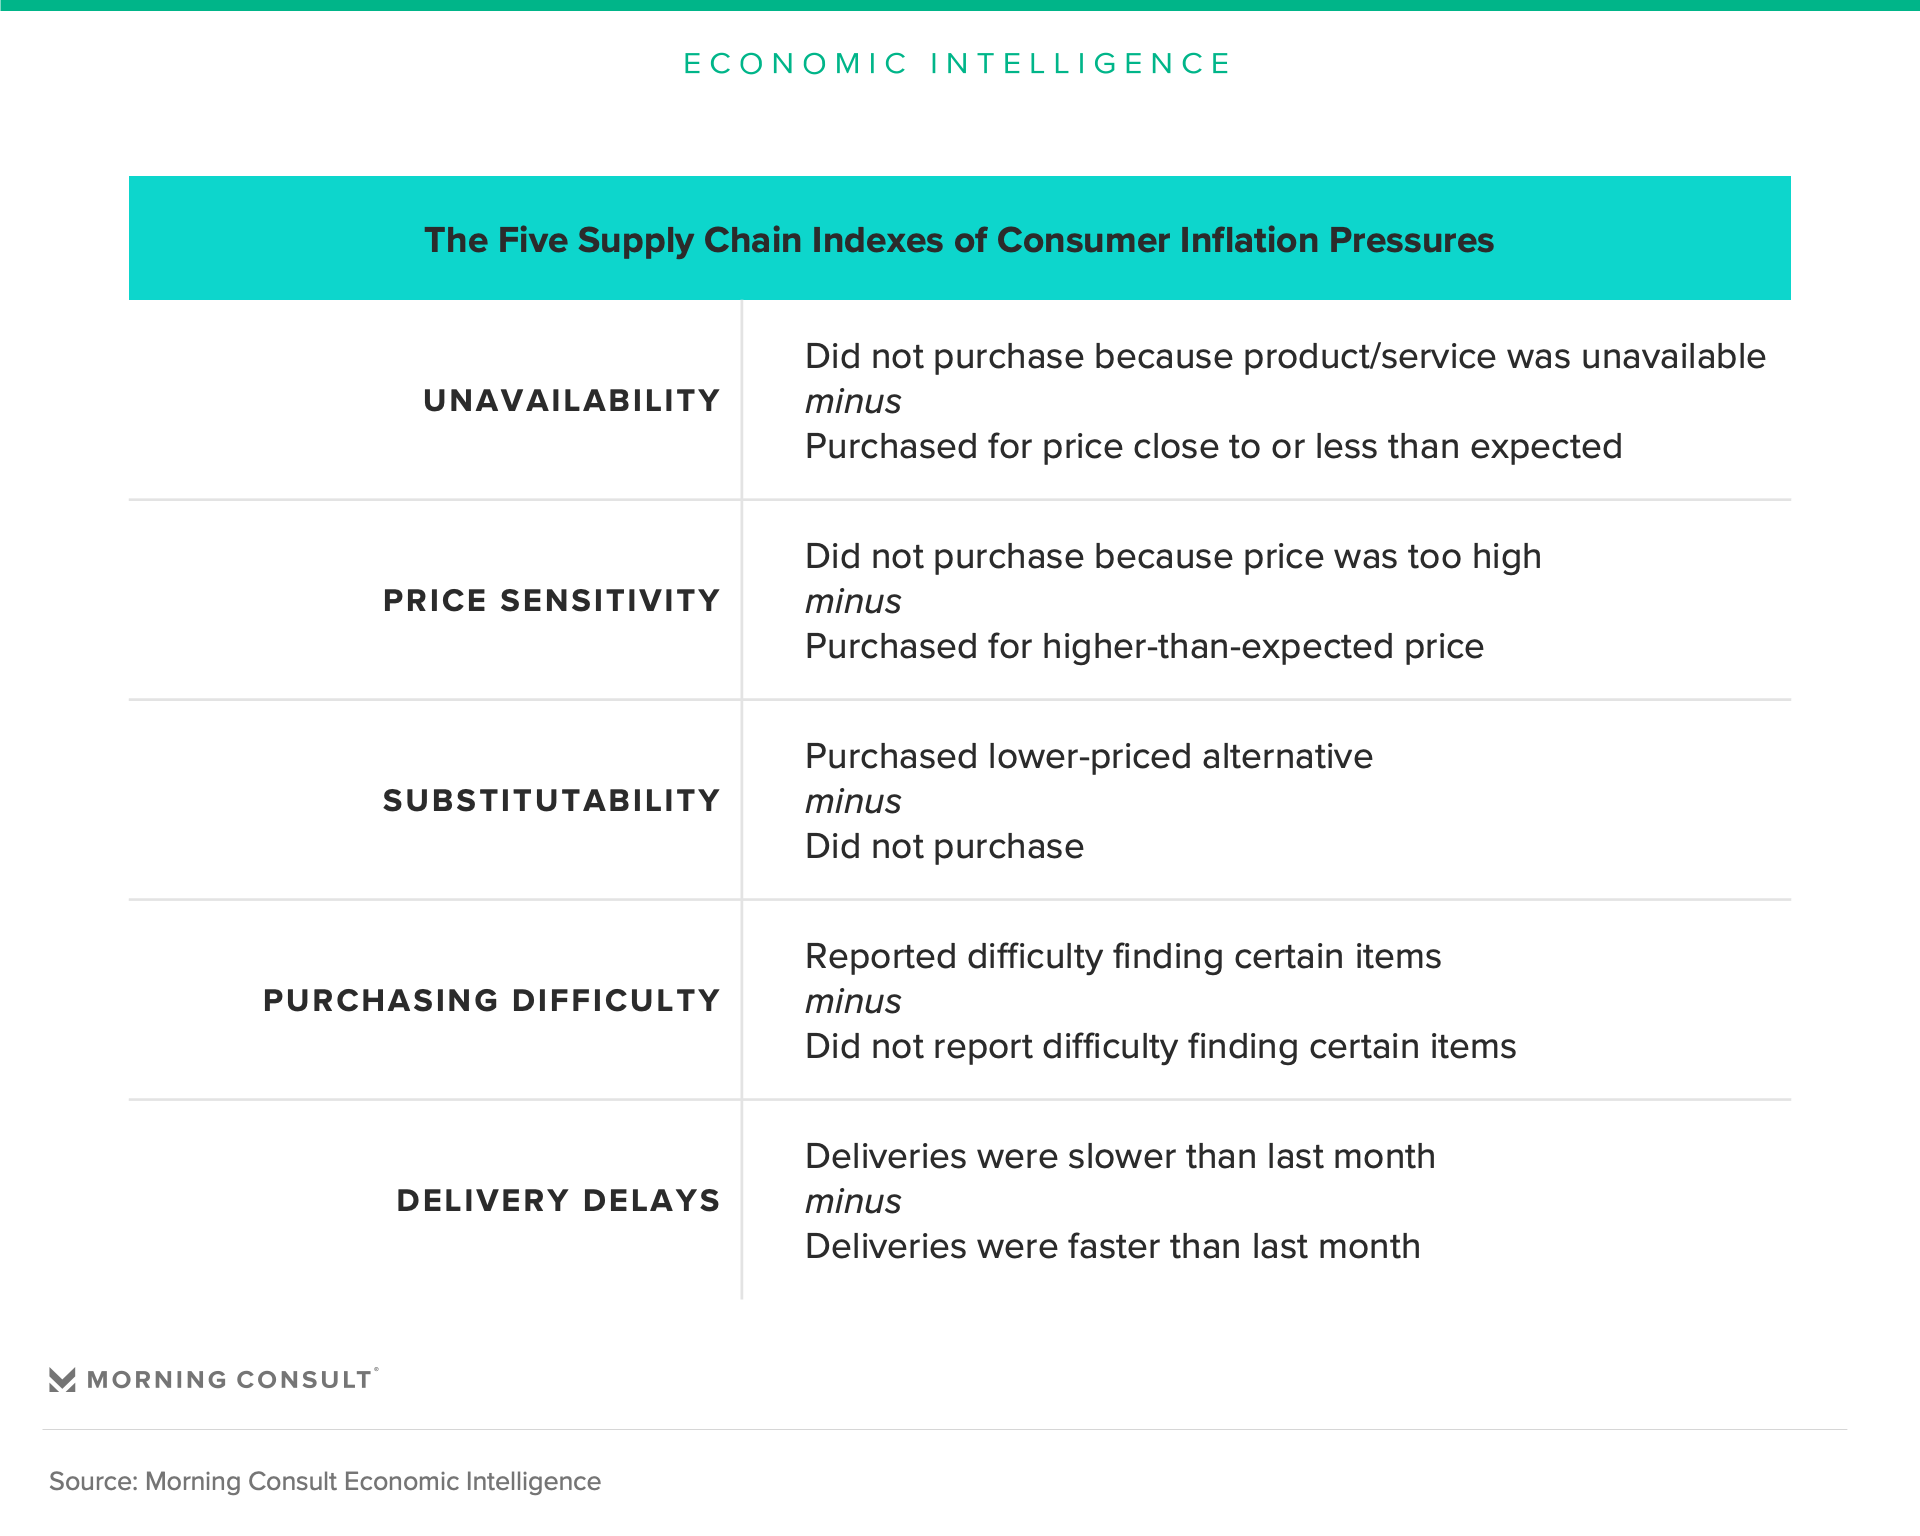
The five concepts tracked by the Supply Chain Indexes of Consumer Inflation Pressures
1) Unavailability: Inability to purchase a product or service
2) Price Sensitivity: Willingness to forgo a purchase when faced with sticker shock
3) Substitutability: Willingness to trade down to a cheaper substitute
4) Purchasing Difficulty: Degree of difficulty in obtaining a product or service
5) Delivery Delays: Speed at which online purchases are delivered
Interpretation of the index scores
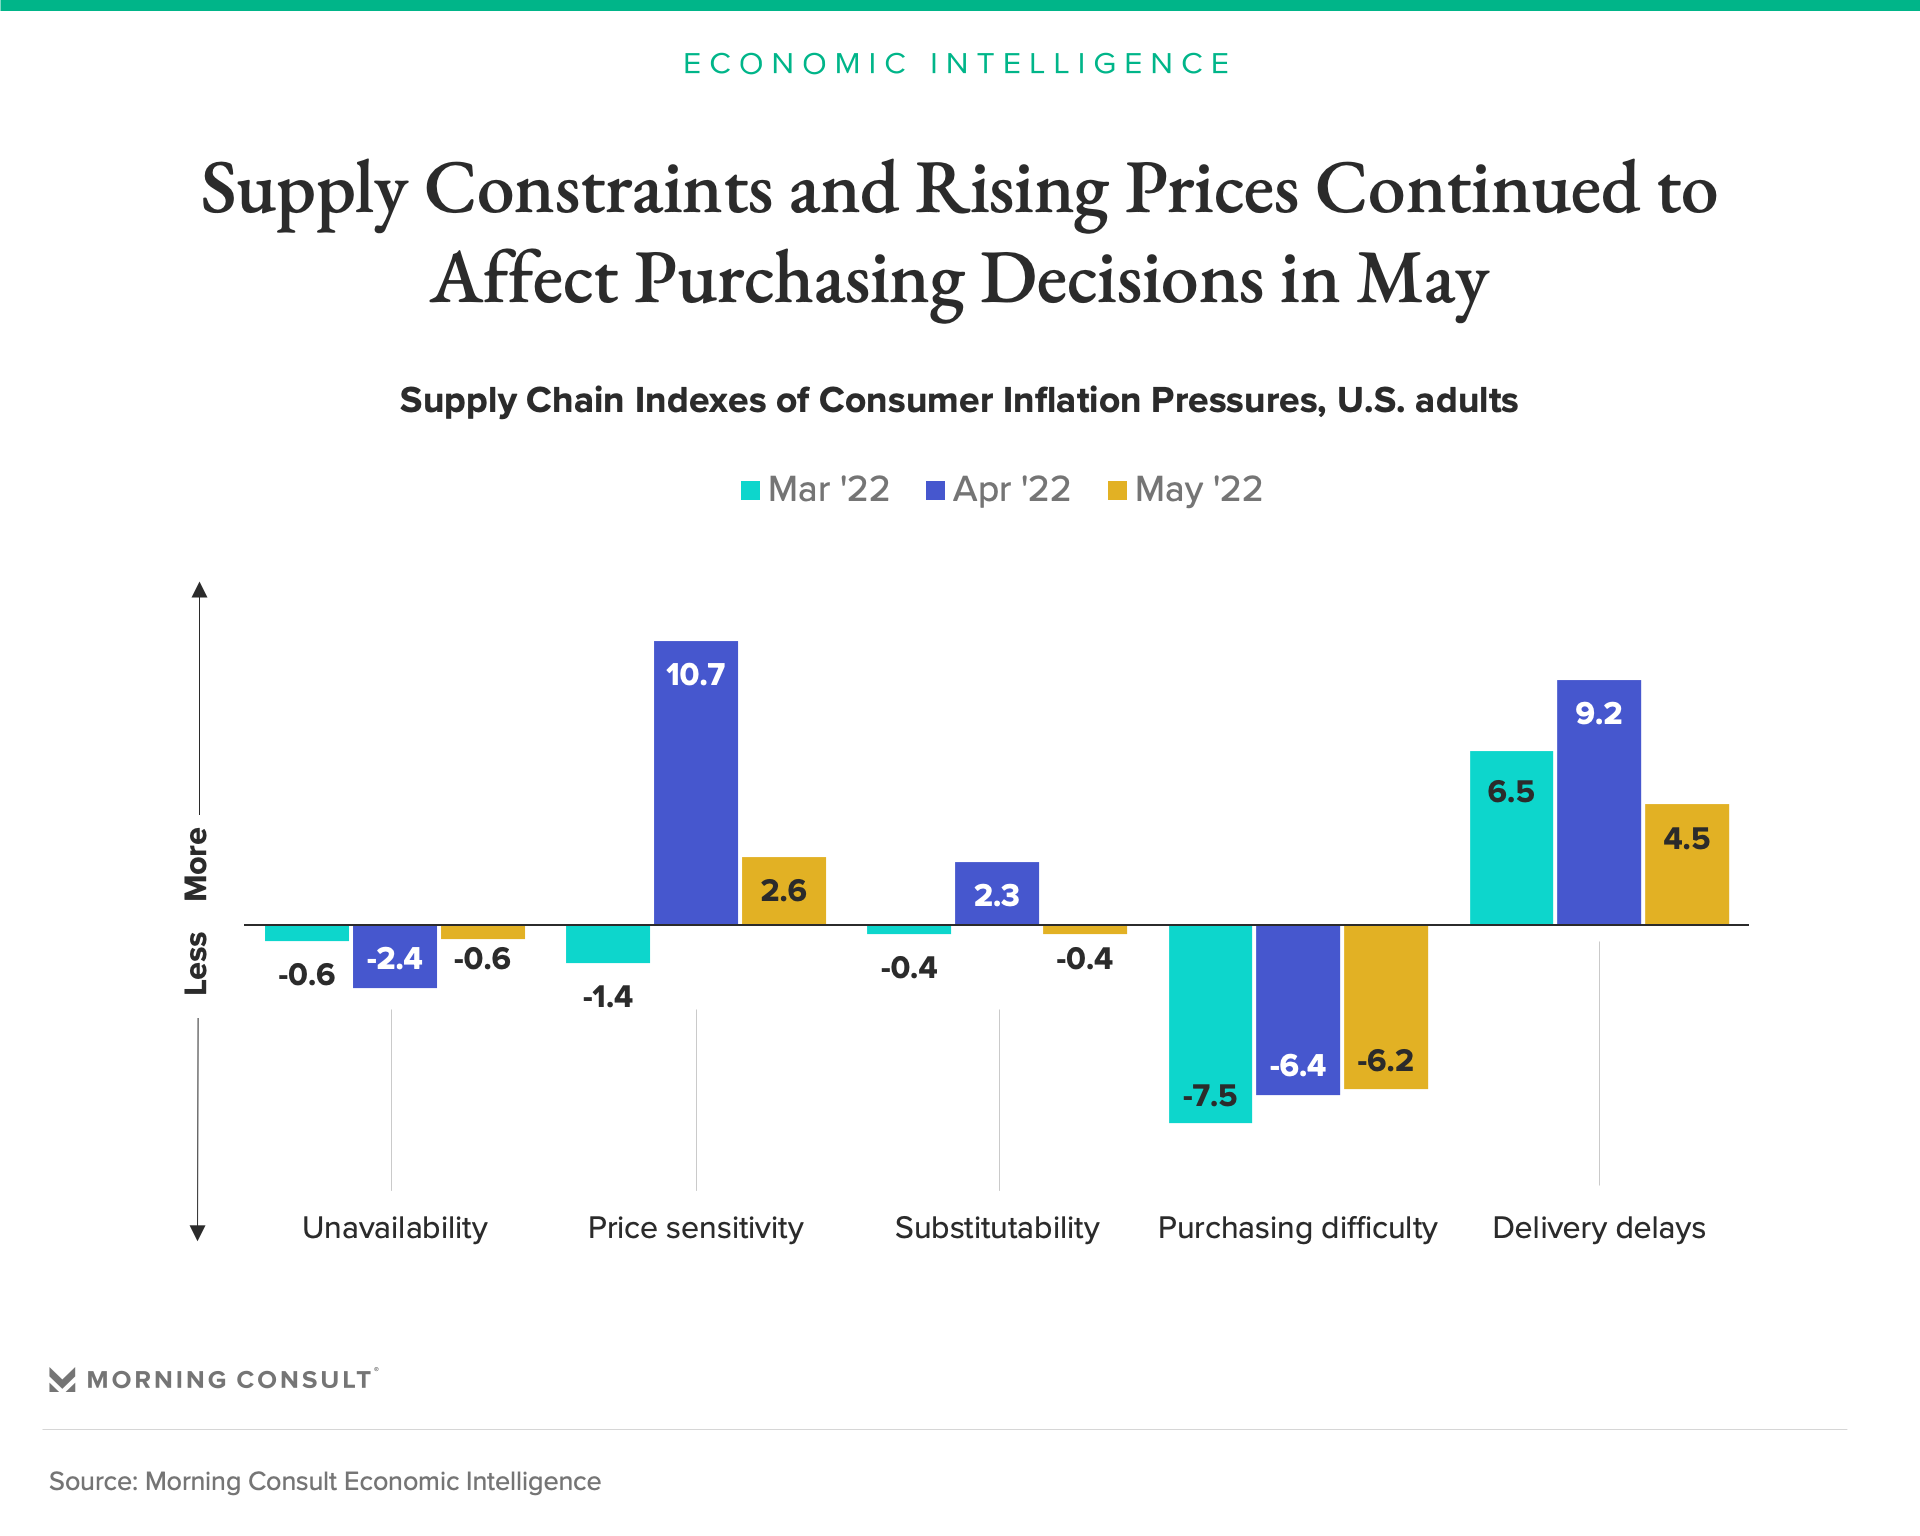
In the U.S. Supply Chains and Inflation report, we label the y-axis for the charts that illustrate the five indexes with a generic “Less/More” description, as shown above. This means that positive index scores correspond to more of an activity (e.g., more trading down), while negative scores correspond to less of an activity (e.g., less trading down). For instance, the 2.6 value for Price Sensitivity in May 2022 reflects the fact that, on average across product/service categories, the share of adults who walked away from a purchase when the price exceeded their expectations was nearly 3 percentage points higher than the share who made the purchase anyway. In contrast, in April 2022, the share of adults who walked away from a purchase in this situation was about 11 points higher than the share who completed the purchase.
An index score of 0, thus, represents a “neutral” value for each concept. Below, we describe how we arrive at this conclusion by building up the net shares of responses at the product/service category level into an aggregate index number. First, however, note that not only are comparisons across indexes for a given month informative, so are comparisons across time for a given index. As an example, the chart above shows that price sensitivity, substitutability and delivery delays decreased from April to May, while unavailability and purchasing difficulty increased.
At the product/service category level, a neutral value means that each of the two possible outcomes for each index had an equal share of responses.
1) A neutral value for Unavailability at the product/service category level denotes that there were equal shares of adults who were not able to purchase a product/service because it was unavailable and who were able to successfully complete a purchase for a price close to what they expected to pay.
2) A neutral value for Price Sensitivity at the product/service category level denotes that there were equal shares of adults who walked away from a purchase and who decided to go ahead with a purchase when the price exceeded their expectations.
3) A neutral value for Substitutability at the product/service category level denotes that there were equal shares of adults who purchased a lower-priced substitute and who decided not to purchase.
4) A neutral value for Purchasing Difficulty at the product/service category level denotes that there were equal shares of adults who had difficulty obtaining a product or service and who had no trouble finding that product or service. In both cases, however, the purchase was still made.
5) A neutral value for Delivery Delays at the product/service category level denotes that there were equal shares of adults who said deliveries of online orders were slower than last month and who said deliveries were faster than last month.
We aggregate the net shares of responses at the product/service category level into an index for each of the five concepts by weighting them according to their relative importance in the Consumer Price Index. In the aggregate, an index score of 0 corresponds to a “neutral” result, in that the weighted average outcome for the concept being measured exhibits equal shares of responses for each alternative. This same procedure can then be applied to different demographics and geographies.
Kayla Bruun is the lead economist at decision intelligence company Morning Consult, where she works on descriptive and predictive analysis that leverages Morning Consult’s proprietary high-frequency economic data. Prior to joining Morning Consult, Kayla was a key member of the corporate strategy team at telecommunications company SES, where she produced market intelligence and industry analysis of mobility markets.
Kayla also served as an economist at IHS Markit, where she covered global services industries, provided price forecasts, produced written analyses and served as a subject-matter expert on client-facing consulting projects. Kayla earned a bachelor’s degree in economics from Emory University and an MBA with a certificate in nonmarket strategy from Georgetown University’s McDonough School of Business. For speaking opportunities and booking requests, please email [email protected]
Scott Brave previously worked at Morning Consult in economic analysis.