Energy
Many, but Not All, Major U.S. Utilities Saw Their Average Emissions Rate Fall Between 2019 and 2020

Key Takeaways
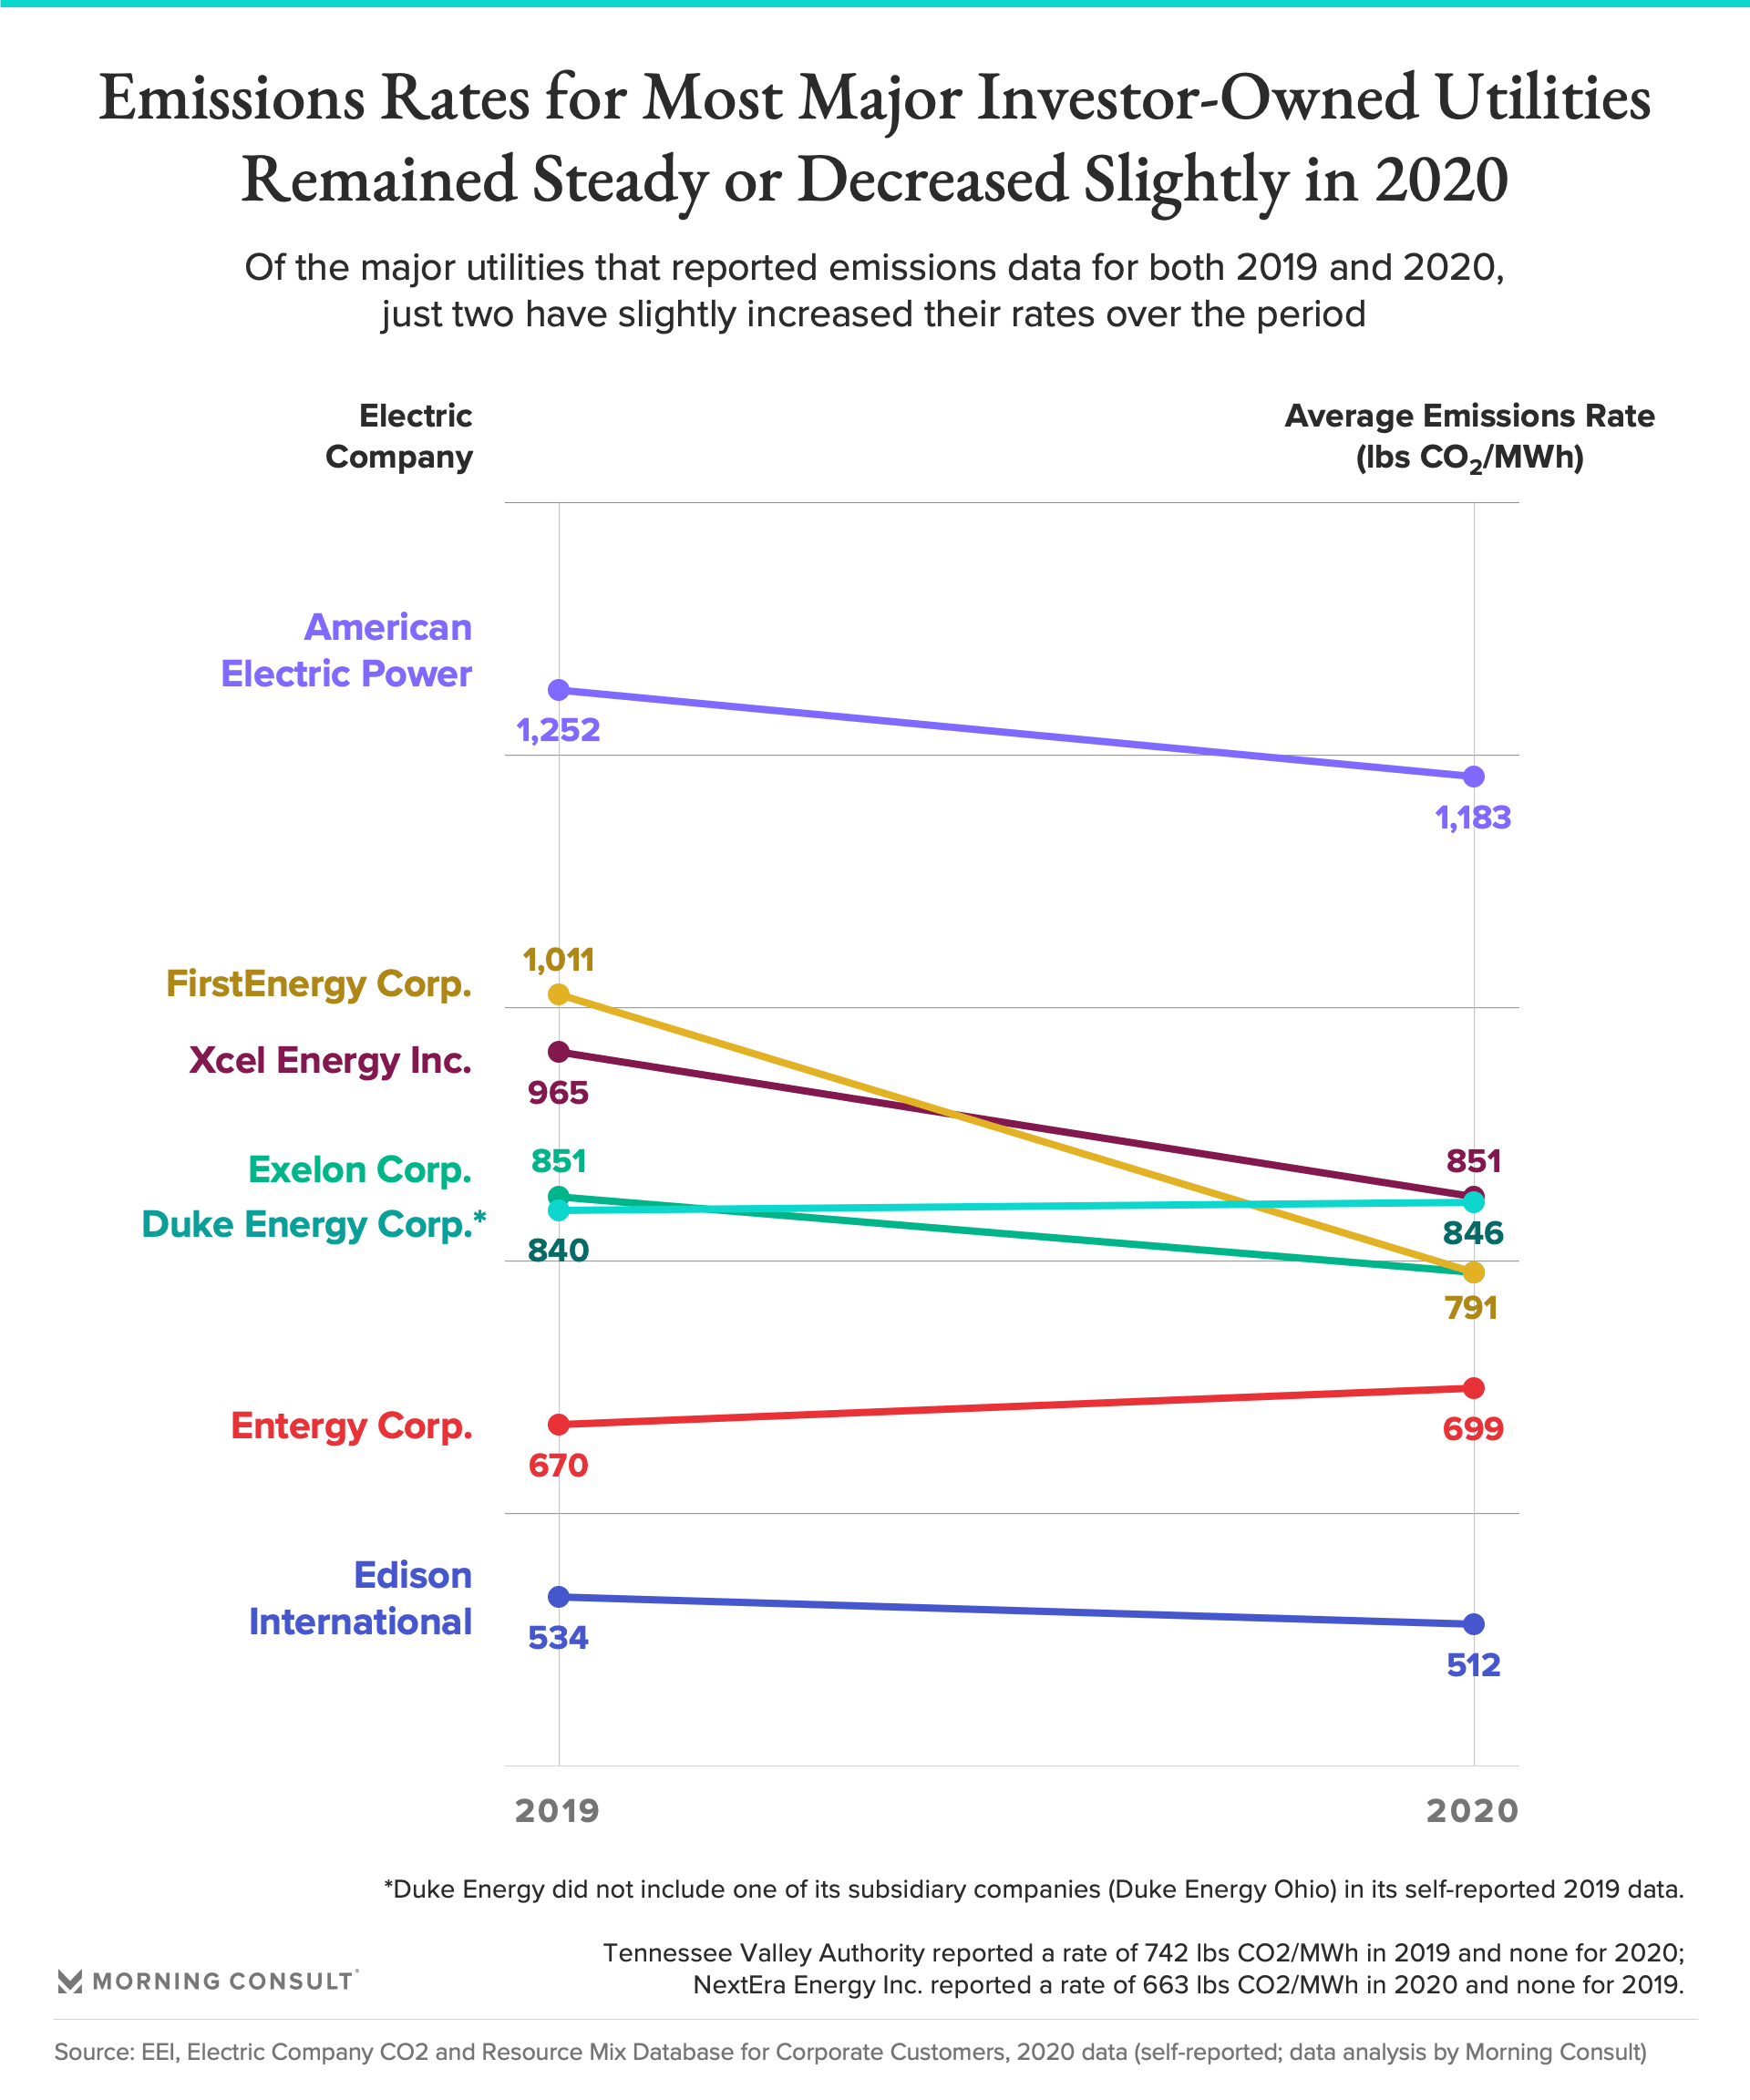
American Electric Power had the highest carbon intensity by a wide margin, though the Ohio-based utility saw a decrease of roughly 5 percent from the company’s 2019 rate.
Meanwhile, FirstEnergy Corp. lowered its emissions most significantly over the period, by 220 lbs. CO2/MWh, or 22 percent.
Even before President Joe Biden arrived in the White House with his carbon-free power sector by 2035 goal in tow, the flurry of emissions commitments by major electric utilities was already underway. The combination of mounting consumer and political pressure -- both on the state and federal levels -- has meant that many power producers have leaned into setting their own decarbonization goals, mostly with the target date of 2050.
And in order to reach them, these utilities will need to drop their emissions rate annually in the coming decades, while transitioning away from using carbon-intensive fossil fuels like coal.
Since 2019, most major electric companies are doing just that, a new analysis of Edison Electric Institute data by Morning Consult has found, with all of those reviewed dropping the share of coal in their resource mixes.
However, comparing the 2020 data to that of the previous year shows that certain companies still lag behind in terms of lowering their emissions rates, their ambitious net-zero pledges notwithstanding.

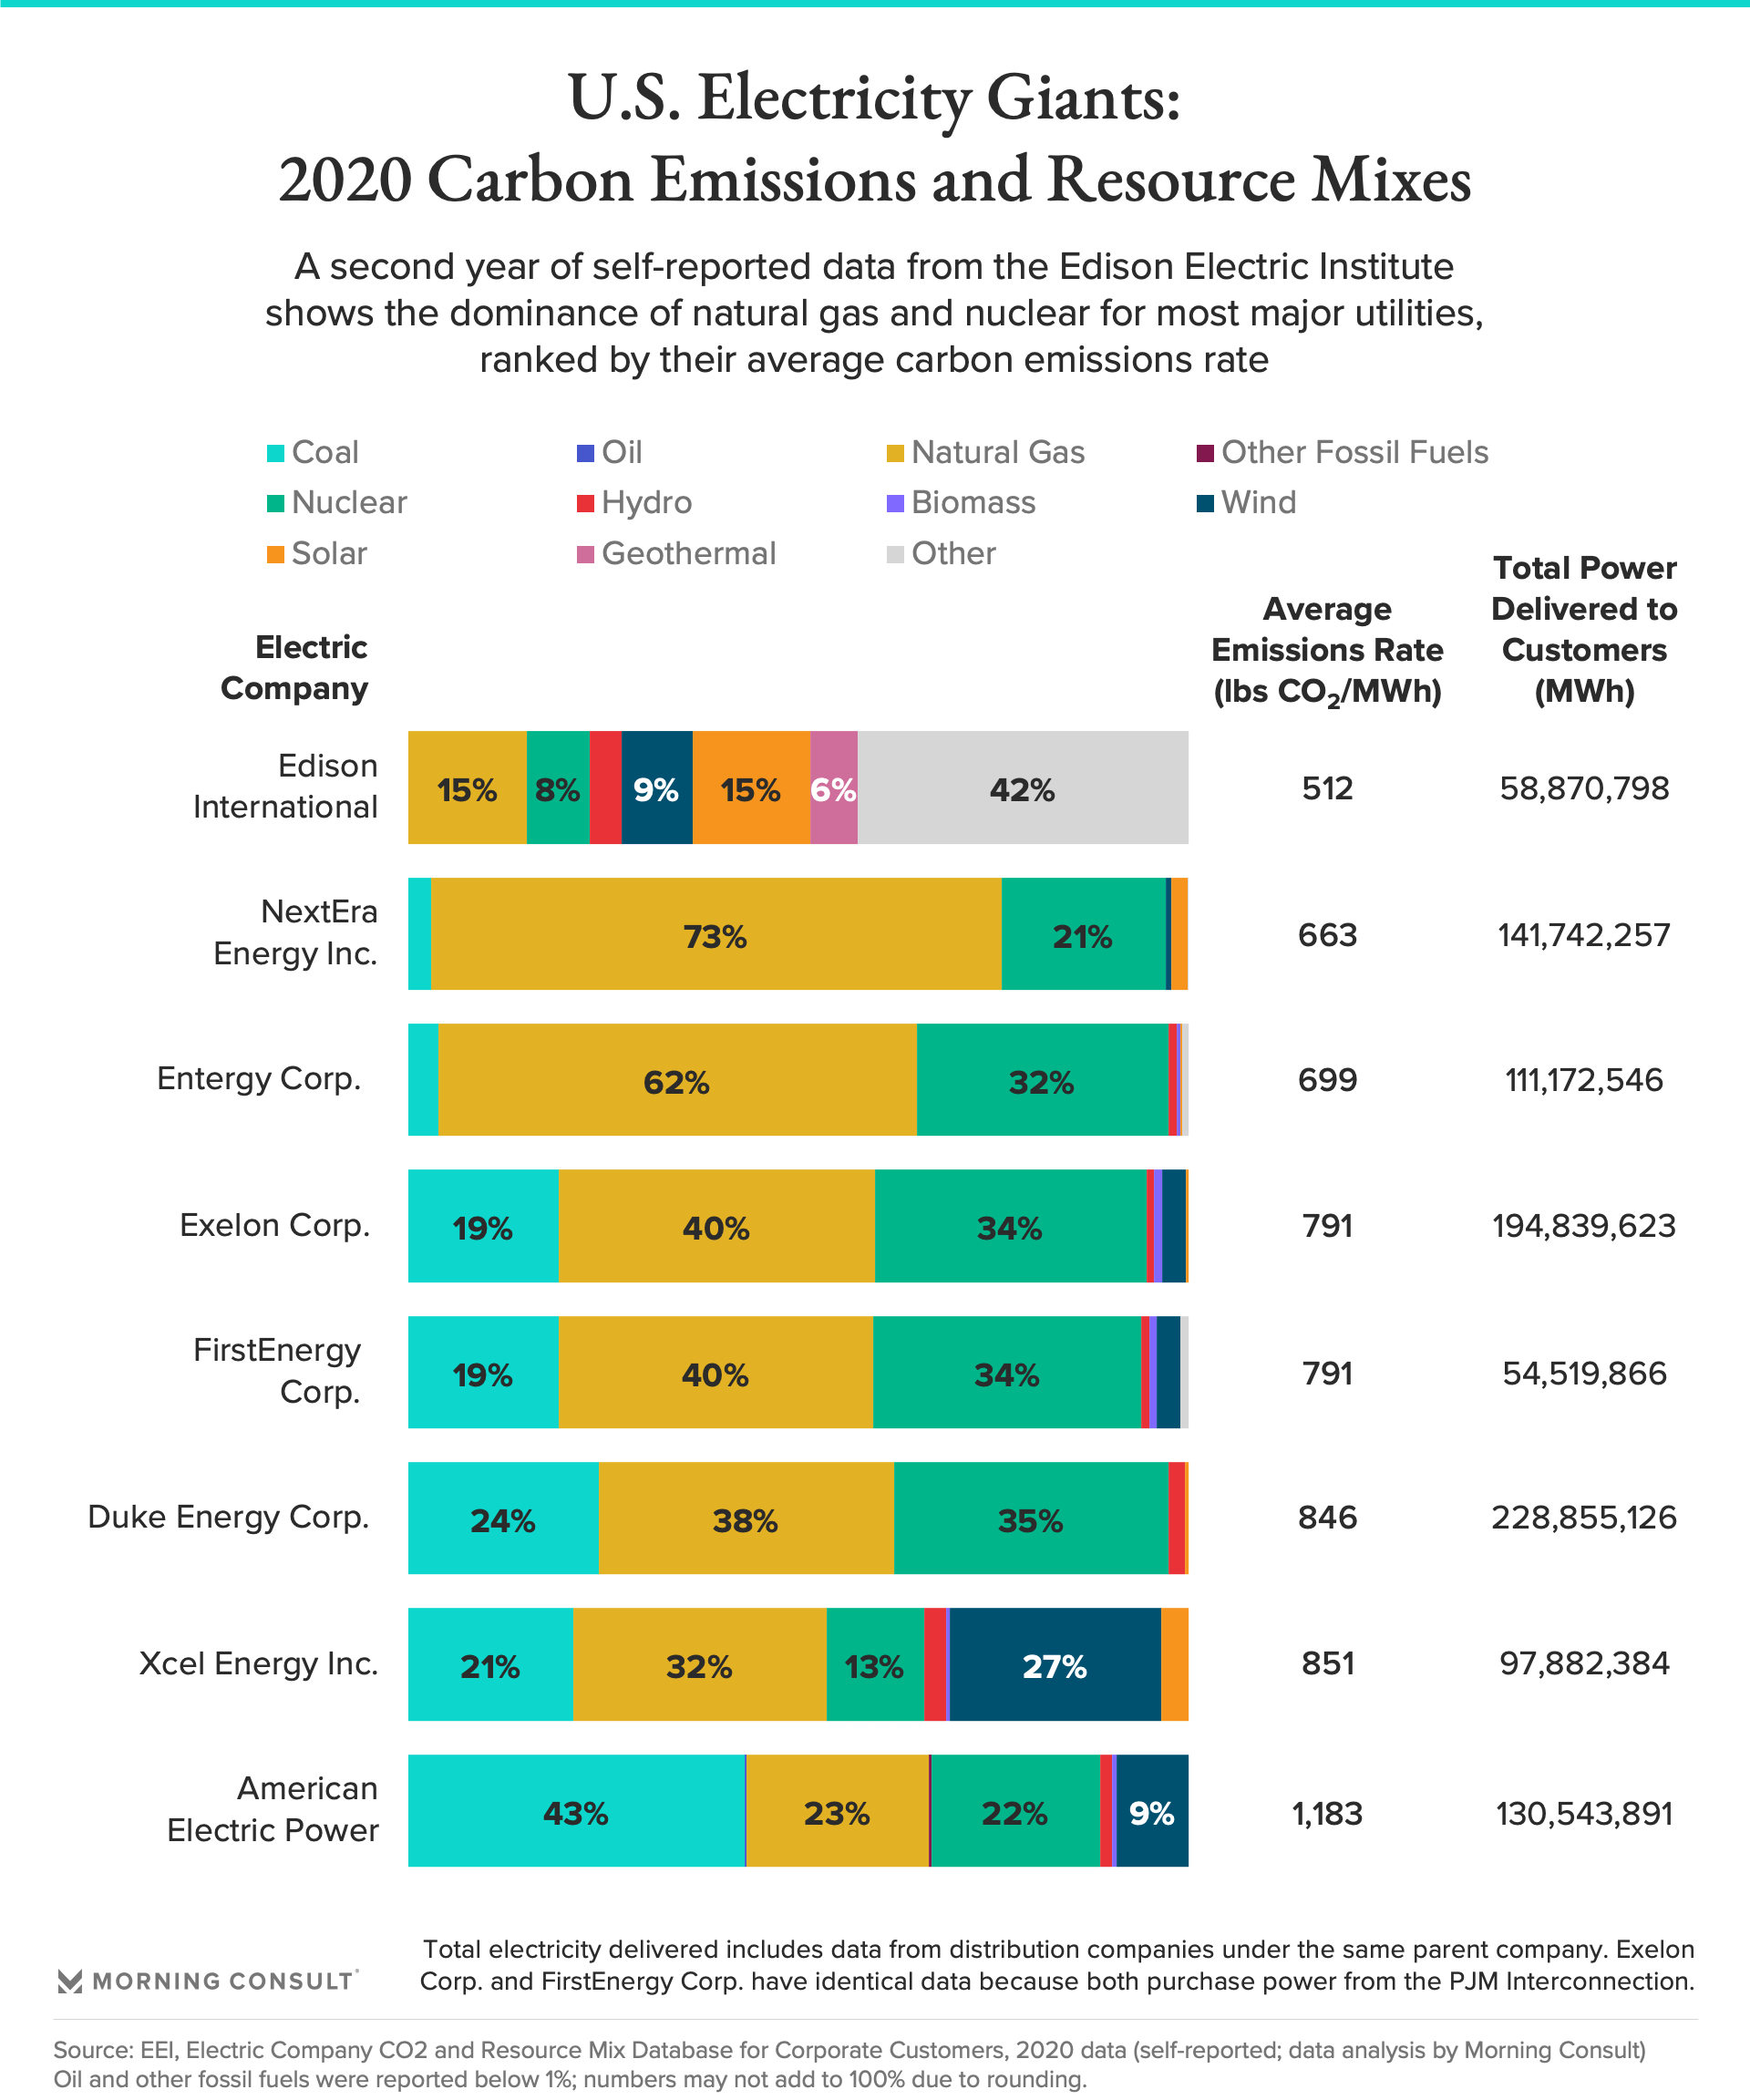
The Ohio-based FirstEnergy Corp. managed to drop its emissions by 220 pounds of carbon dioxide per megawatt-hour, or by roughly 22 percent, the most substantial drop across the utilities reviewed. FirstEnergy had both the same carbon intensity and nearly identical resource mix as Exelon Corp., which EEI said is due to the fact that both companies purchase power for delivery to customers via the PJM Interconnection market in the mid-Atlantic and Appalachian region.
Meanwhile, Edison International -- which has had the lowest carbon intensity for two years in a row -- saw a more minor drop of 4 percent, while Entergy Corp. saw a 4 percent uptick over the same period.
The Ohio-headquartered American Electric Power has the highest carbon intensity by a wide margin, at 1,183 lbs. CO2/MWh in 2020, which represents a decrease of roughly 5 percent from the company’s 2019 rate.
While Duke Energy Corp. apparently saw a slight increase (1 percent) in its emissions rate, the company did not include its subsidiary Duke Energy Ohio -- which has a markedly high emissions rate but produces just a fraction of the company’s overall delivered power -- in its 2019 self-reported data. Excluding Duke Energy Ohio from the 2020 analysis shows the carbon intensity for the company’s other subsidiaries remained basically steady. Duke has set a target of net zero emissions by 2050.
The trade group EEI represents all investor-owned electric companies in the country. A year ago, the group began working with the nonprofit World Resources Institute to create a database of each regulated utility’s carbon emission intensity, resource mix and other information in 2019 data. This year’s update to the database, with 2020 data, was released on June 17.
A number of the power producers also have commercial enterprises -- which in some cases are investing more in renewable energy than the resource mix of their regulated utilities might suggest -- under their broader corporate umbrellas, which are not necessarily included in the data reported to EEI.

Since 2019, all utilities have lowered their use of coal as a share of their resource mix; Xcel Energy Inc.’s use of coal dropped the most dramatically, from roughly 27 percent to 21 percent of its resource mix.
Meanwhile, the use of wind resources in particular has broadly increased, especially for Xcel (from 21 percent to 27 percent). Natural gas use has remained relatively steady or increased across the board. NextEra Energy Inc., which provided data for 2020 but not for 2019, relies most substantially on gas, at a share of 73 percent.
Edison International, which operates in Southern California, continues to rely on the widest variety of energy sources in its resource mix, including 15 percent solar and 9 percent wind.
The companies mentioned are among the largest in the country, though they vary widely in terms of how much electricity they deliver to customers (from roughly 55 million MWh to 229 million MWh in 2020) and in terms of geography; some have easier access to renewable or nuclear resources than others.
A number of major utilities -- most notably Dominion Energy Inc., one of the largest in the country -- did not report their data to EEI.
The database is intended to facilitate EEI’s members calculating their Scope 2 carbon emissions under a standardized corporate reporting system, and includes carbon emissions intensity rates for each distribution company both with and without accounting for renewable energy certificates; Morning Consult’s analysis relied on the former.
Some but not all of the reported carbon intensity rates have been third-party verified by the Environmental Protection Agency or the Climate Registry’s General Verification Protocol.
Correction: This story and its accompanying graphs were corrected to reflect an updated analysis of average emissions rates. The original analysis used a simple -- rather than weighted -- average of subsidiary companies’ emissions rates to calculate the overall 2019 and 2020 rates, which skewed the result slightly for several companies and more significantly for both Duke Energy and NextEra Energy Inc. While the original analysis showed Duke Energy increasing its emissions rate by 13 percent over the period, the updated analysis shows the company keeping its rate roughly steady from its lower 2019 base.
Lisa Martine Jenkins previously worked at Morning Consult as a senior reporter covering energy and climate change.