Blog
How Morning Consult Weights U.S. Voter Survey Data

Developing accurate survey estimates requires attention to detail at every stage of the research process. Every methodological step – from sampling decisions to how the researcher phrases a question to respondents – can have major effects on the outcome one is measuring. One of the steps in this pipeline is survey weighting. In this brief explainer, we will introduce why survey weighting is needed and how we typically weight data at Morning Consult. We’ll close with a case study on how we weight U.S. political research at the state-level.
Why is it necessary to weight survey data?
Weighting data is one of the many tools that survey researchers leverage to improve the accuracy of sample estimates for drawing inferences about the population of interest. Despite best efforts to ensure that the collected sample closely mirrors population characteristics, it is often necessary to make adjustments to the data by upweighting respondents that are underrepresented relative to the population and downweighting respondents that are overrepresented.
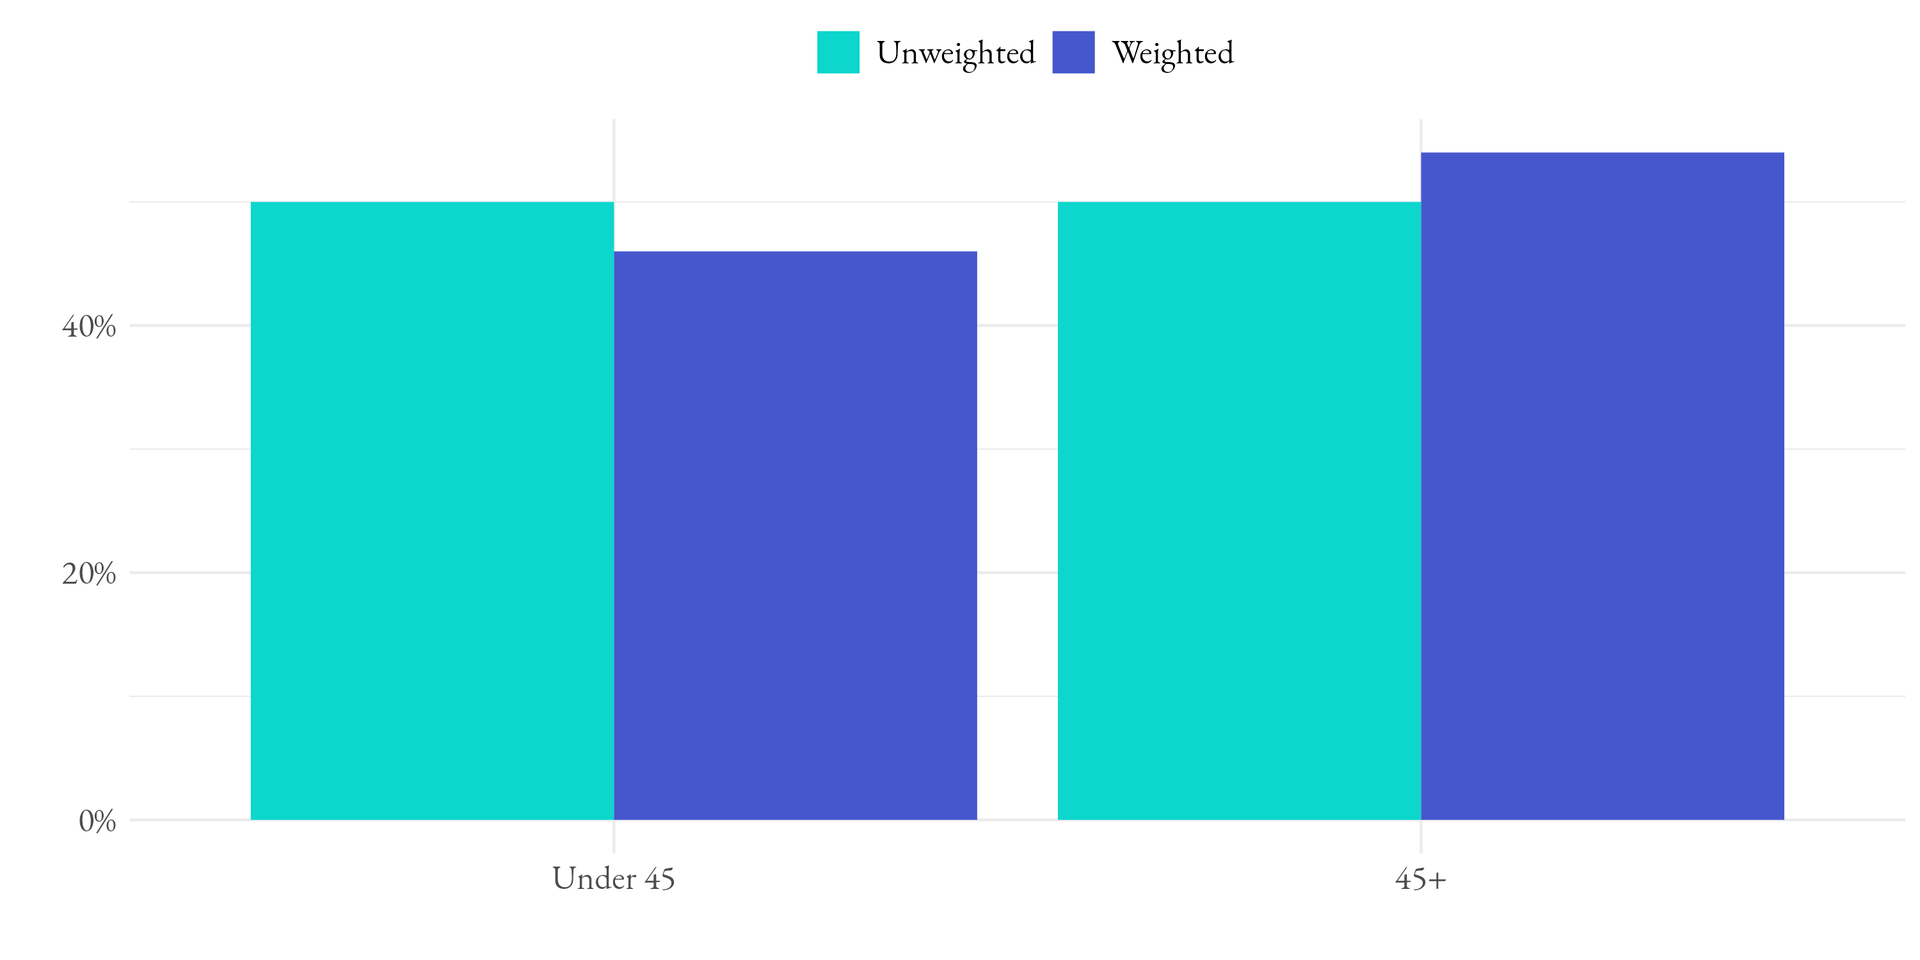
For example, imagine that we collect a 100 respondent sample of the 18+ adult population in the United States. In our sample, we might have collected 50 respondents (or 50% of the sample) under the age of 45 and 50 respondents who were 45 or older. However, population estimates might dictate that we should expect only 46 respondents (or 46% of the population) under the age of 45 and 54 respondents to be 45 or older. To adjust our data so it reflects the population, we need to downweight respondents under 45 years of age and upweight those respondents 45 or older. Figure 1 illustrates this example.
Adjusting our sample so that it matches known population parameters is a necessary step for all survey research to make inferences and reduce any statistical bias that might be introduced by factors such as non-response.

Leveraging high-quality population data
In order to weight survey data so it is representative of the target population, researchers need access to high-quality, reliable information about the population. In the United States, researchers often draw on data produced by the U.S. Census Bureau. At Morning Consult, we commonly use population measures drawn from the American Community Survey (ACS), the Current Population Survey (CPS) and the Survey of Income and Program Participation (SIPP).
Each population data source has advantages and disadvantages for developing weighting targets. For example, the CPS is the only of the three surveys that asks questions around voter registration status (specifically in the biennial Voting and Registration supplement fielded in November of each election year). Likewise, the SIPP survey is the only one of the three that reports property loan amounts. Nevertheless, many products from the U.S. Census rely on common content that makes comparison across surveys fairly trivial.
At Morning Consult, we often prioritize using population data published by government agencies. However, for surveys fielded in some countries and for niche audiences, we may be required to use alternative data sources from academic or high quality industry sources.
How we determine which variables to use for balancing
To weight a sample to population targets, the researcher also needs to consider the set of attributes that she or he wishes to balance the sample. Typically, these attributes might include demographic, geographic, economic, or political characteristics. For example, to weight a political survey a pollster may weight the sample according to age, gender, race, educational attainment, region, household income, and/or political party affiliation, among other features. But how might they decide which to use?
Morning Consult typically evaluates potential weighting variables according to five criteria:
- Population data availability. Ideal weighting targets are available through high-quality sources. For example, while population data is easily accessible for demographic attributes like age and gender, it is much harder to find accurate, reliable population data about behavioral or attitudinal attributes.
- Long-term stability of population measures. Ideal weighting targets are relatively stable and do not change significantly year-over-year or month-over-month. For example, while the demographic profile of the United States population is changing all the time, trends are relatively stable, especially compared to more dynamic alternatives like party identification which can change based on current events and proximity to election day.
- Measurement congruence between the sample and population. Ideal weighting targets are measured similarly in the population and in the sample. For example, there are a number of ways to measure respondents’ partisanship – such as self-reported party identification or party registration. To reduce any unintended effects due to measurement error, it is prudent to leverage population variables that can be collected similarly in-survey.
- Relation with relevant outcomes. Ideal weighting targets are related to the outcomes of interest. For example, it might be necessary to ensure the sample composition is adjusted on past vote choice when measuring political opinions and attitudes but unnecessary when measuring customer satisfaction. Determining relationships between potential weighting variables and relevant outcomes is typically done by validation, back-testing, and statistical analyses.
- Considered to be industry standard. Ideal weighting variables are generally agreed upon across the survey research industry. This means turning to sources like AAPOR’s weighting resources, Pew Research Center’s latest research on weighting online studies, and market research associations for guidance on best practices.
A deeper look into Morning Consult’s political weighting
Morning Consult conducts high-frequency political polling covering national and state elections, issues, and policies. Here we’ll focus on how Morning Consult weights political data, including how we define our target population, the population data sources that we typically use, the variables used (and not used) in weighting, and an example of our weighting in action.
For political projects, Morning Consult typically targets registered voters (RVs) and often filters to likely voters (LVs) using a likely voter screening question. However, since RVs are the starting point, our target population is all registered voters in the United States. That means we are using survey weighting to ensure that our data is representative of the full registered voter universe.
Starting in the 2024 election cycle, we have sourced our population estimates for demographic items from two sources: the American Community Survey (ACS) and the Current Population Survey CPS). We rely on these two sources because each has advantages and disadvantages. For example, the ACS has a larger sample size than the CPS – which produces more accurate demographic estimates, especially within states and regions. However, only the CPS provides data on self-reported voter registration status.
To connect these two data sources, we built an imputation model based on a random forest to append information around registered voter status onto the ACS microdata. This modeled registered voter status was a numerical value between 0-1 indicating that respondent’s probability of being a registered voter. This score was then used to extract the demographic distributions for the geographies of interest (nationwide, state, etc.) to serve as weighting targets. This allows us to leverage the geographical granularity of the ACS while still representing registered voters.
When weighting national political data, we typically make adjustments according to the following variables: age, gender, educational attainment, race/ethnicity, marital status, parental status, home ownership, region, and 2020 presidential vote choice. For state-level political data, we leverage the same set of variables except weighting models might vary slightly by state to account for local factors. Overall, these variables are selected – for both the national and state-level estimates – according to the criteria noted above, with a particular emphasis on the relationship to political outcomes.
Because they do not meet the criteria for inclusion described in the section above, Morning Consult typically does not weight our survey data by party identification or income, even though other political pollsters might rely on these measures. Party identification does not meet our criteria of “long term stability.” For example, Gallup finds significant movement in party identification over the course of a year. In 2024 data alone, Republicans made up as high as 30% and as low as 25% of adults. Income fails to meet our criteria of “measurement congruence.” The CPS and ACS measure income using a combination of over a dozen individual survey questions and administrative data, whereas typical political polls measure income with a single survey question.
For example, in our recently released state polling series, Morning Consult reported that Vice President Kamala Harris is leading former President Donald Trump by 2 percentage points among likely voters in Pennsylvania (field dates Sept. 9 - 18, 2024, fielded online, unweighted n = 1,699). For this data series, our registered voter sample is adjusted by the following variables: gender, age, educational attainment, race/ethnicity, home ownership, marital status, parental status, 2020 presidential vote choice, and in-state region. After trimming weights at the 1st and 99th percentile, the weights for this sample resulted in a design effect due to weighting of 1.38.
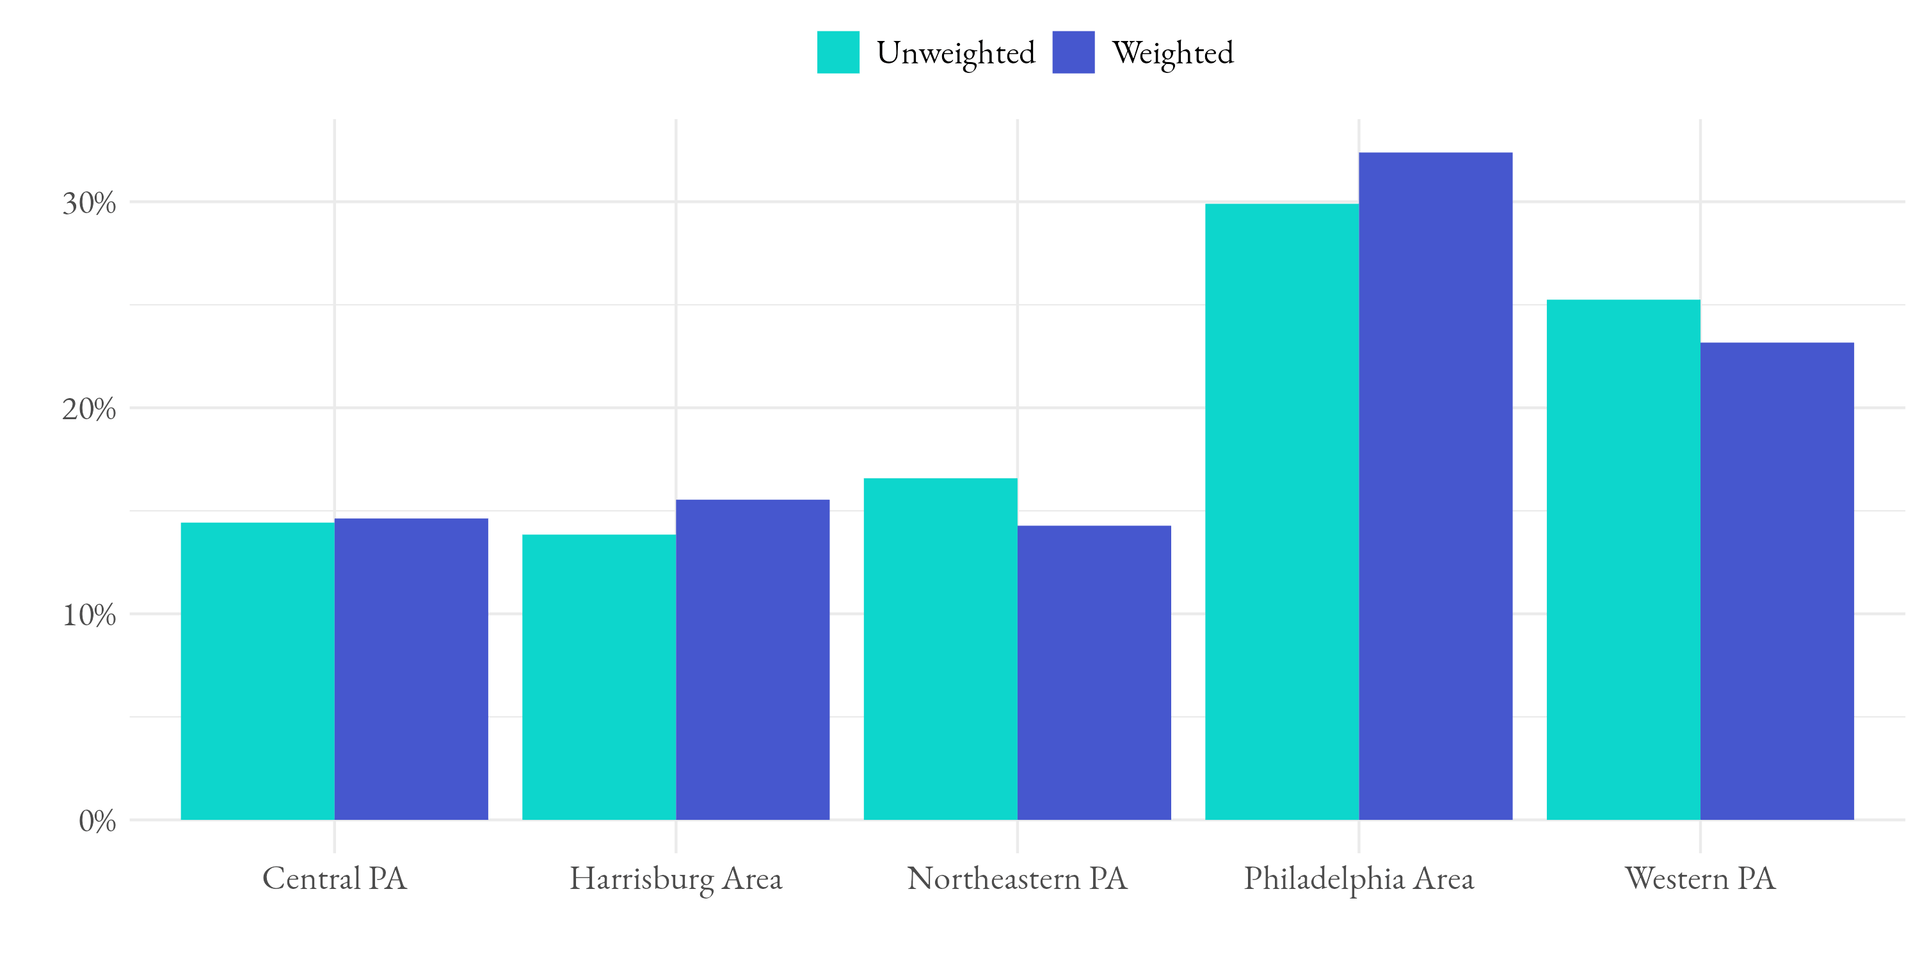
Figure 2 below shows the impact of the adjustments among the five geographic regions used within the weighting model. As the figure shows, some regions like the Philadelphia Area, had respondents were slightly weighted up while respondents in Northeastern Pennsylvania were slightly weighted down. The largest difference between the unweighted and weighted among the geographic distributions is 2.3pp.

Following this weighting procedure, the Pennsylvania sample is balanced based on the demographic, economic, geographic, and political features identified above to match the population targets derived from the high quality, government data sources above. For even more information about that survey’s methodology, visit the 2024 methodology explainer on our state-level polls page.
For more information about Morning Consult’s methodology, check out our Survey Research Innovation blog.
The need for quality data is more important than ever. Morning Consult surveys thousands of people around the world every day, pairing that exclusive, forward-looking survey data with analytical applications, to offer a distinct, competitive advantage for our users and cement our leadership in the decision intelligence category. This content highlights what we do, how we do it and more, featuring know-how from our in-house experts.