Measuring Consumer Spending: How Morning Consult’s Data Compares to Other Sources
Key Takeaways
Morning Consult’s consumer spending data is one of many sources for tracking consumer purchasing behaviors, thus fulfilling a similar role as government data sources such as Monthly Advance Retail Sales (MARTs) or Personal Consumption Expenditures (PCE).
There are similarities in spending trends across these datasets, but also methodological differences that at times lead to different findings – with certain categories of goods and services more impacted than others.
Morning Consult’s spending data complements the topline view provided by government statistics by providing a direct consumer perspective and demographic detail on a monthly basis.
Consumer spending is the single largest component of overall economic growth, making up nearly 70% of gross domestic product. But what do we mean when we say “consumer spending”? There are various measures of spending, including data released by government agencies such as the Bureau of Economic Analysis, Bureau of Labor Statistics and Census Bureau. This memo explains how Morning Consult’s data fits into this picture – how it compares to and complements the most widely used government data, and how best to use it to derive valuable insights on U.S. consumer spending behavior.
Overview of spending datasets
Morning Consult’s monthly spending data, which is derived directly from consumer surveys each month, is designed to reflect spending from the perspective of an average consumer, as well as offering demographic detail for both topline spending and category-specific trends. It is most similar in construction to the Bureau of Labor Statistics’ Consumer Expenditure survey – but on a monthly frequency rather than the BLS’s annual cadence, and without the longer publishing lag time.
The most comprehensive monthly consumer spending measure released by the government is the personal consumption expenditures (PCE), estimated by the Bureau of Economic Analysis (BEA) and covering a broad array of goods and services categories. For retailers, however, the Advance Monthly Retail Trade survey (MARTs), published by the Census Bureau ahead of PCE each month, may be the most relevant data release. Both of these surveys offer aggregate spending levels, collected mainly from businesses rather than consumers. These topline figures can at times obscure important nuances playing out in the purchasing behaviors exhibited by various demographic groups, underscoring the unique and complementary value of Morning Consult’s monthly data.
Retail spending benchmark: Census Bureau’s Advance Monthly Retail Trade Survey
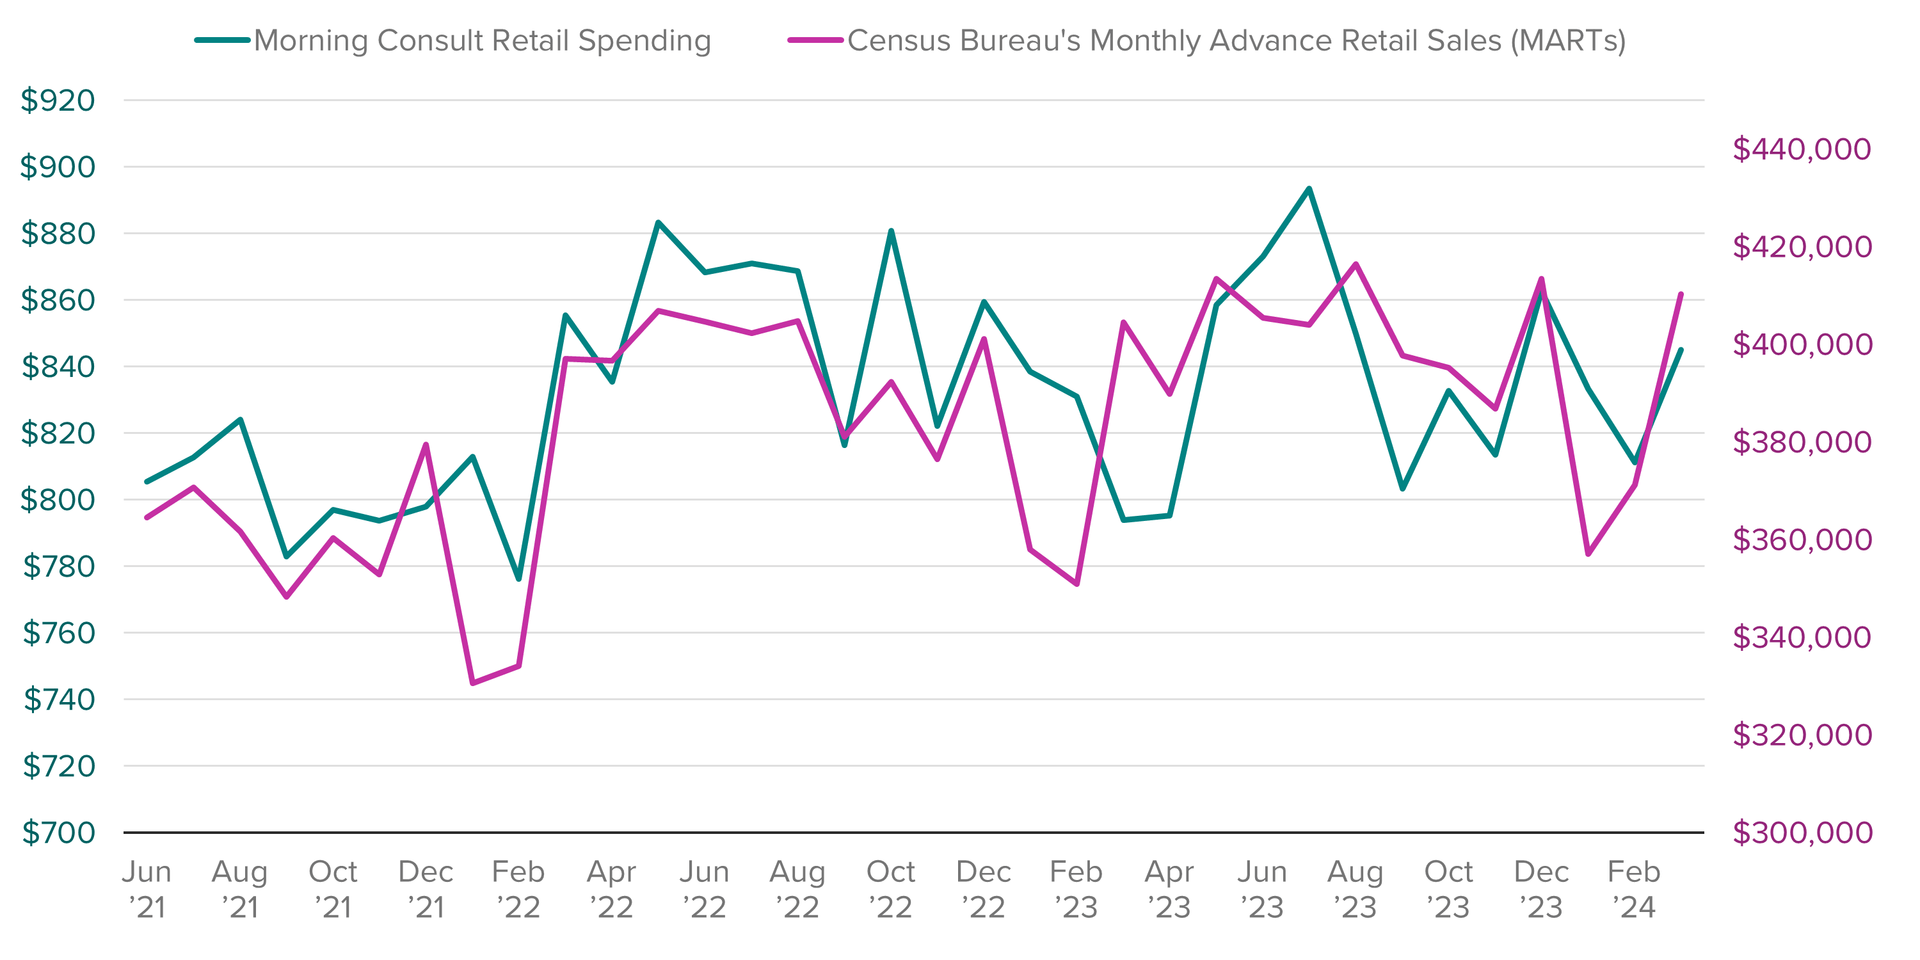
In our monthly report on consumer spending, we often show Census Bureau’s retail sales data alongside the sum of Morning Consult’s corresponding retail categories. Overall, the topline value for retail categories covered by Morning Consult and the MARTs data has a moderately strong correlation historically (.66).
Morning Consult’s Spending Measure Is Similar but Not Identical to Government Retail Sales
However, there are known methodological differences contributing to occasional discrepancies in trends for each data set:
- Coverage: The topline MARTs data covers retail goods and food and beverage services. Morning Consult collects spending data on a broader range of categories, including services. Morning Consult’s total spending covers about 94% of the full consumer basket per the BLS’s relative importance estimates, whereas the physical goods and restaurants that make up the total retail spending add up to only about 41%.
- Sample: Morning Consult’s data is based on a survey of consumers, who are asked to report total spending per good or service category for their household each month. The MARTs data is collected directly from businesses grouped by store type, who report aggregate monthly sales.
- Timing: The different sample sets can lead to differences in timing between when a consumer reports spending and a business recognizes revenue from a sale. For example, when a car dealership makes a sale, the full retail price for the vehicle will be recognized in a single month at the time of sale in the MARTs survey. However, from the consumer’s perspective, payment is often financed and paid out in installments over time; in Morning Consult’s survey, an auto purchase would instead add incremental recurring spending amounts for the duration of the loan. Additionally, the rise of buy-now-pay-later (BNPL) could increasingly contribute to timing differences as more purchases are paid off over time by consumers. This dynamic may be apparent in early 2023: When spending dipped dramatically for MARTs directly following the holidays, Morning Consult’s spending on retail categories initially remained elevated before dropping. The disparity may be suggestive of factors like BNPL distributing the seasonal spending spike over a longer period from the perspective of consumers. Using a 3-month moving average in order to smooth some of the timing differences boosts the correlation between Morning Consult’s retail sales and MARTs from .66 to .81.
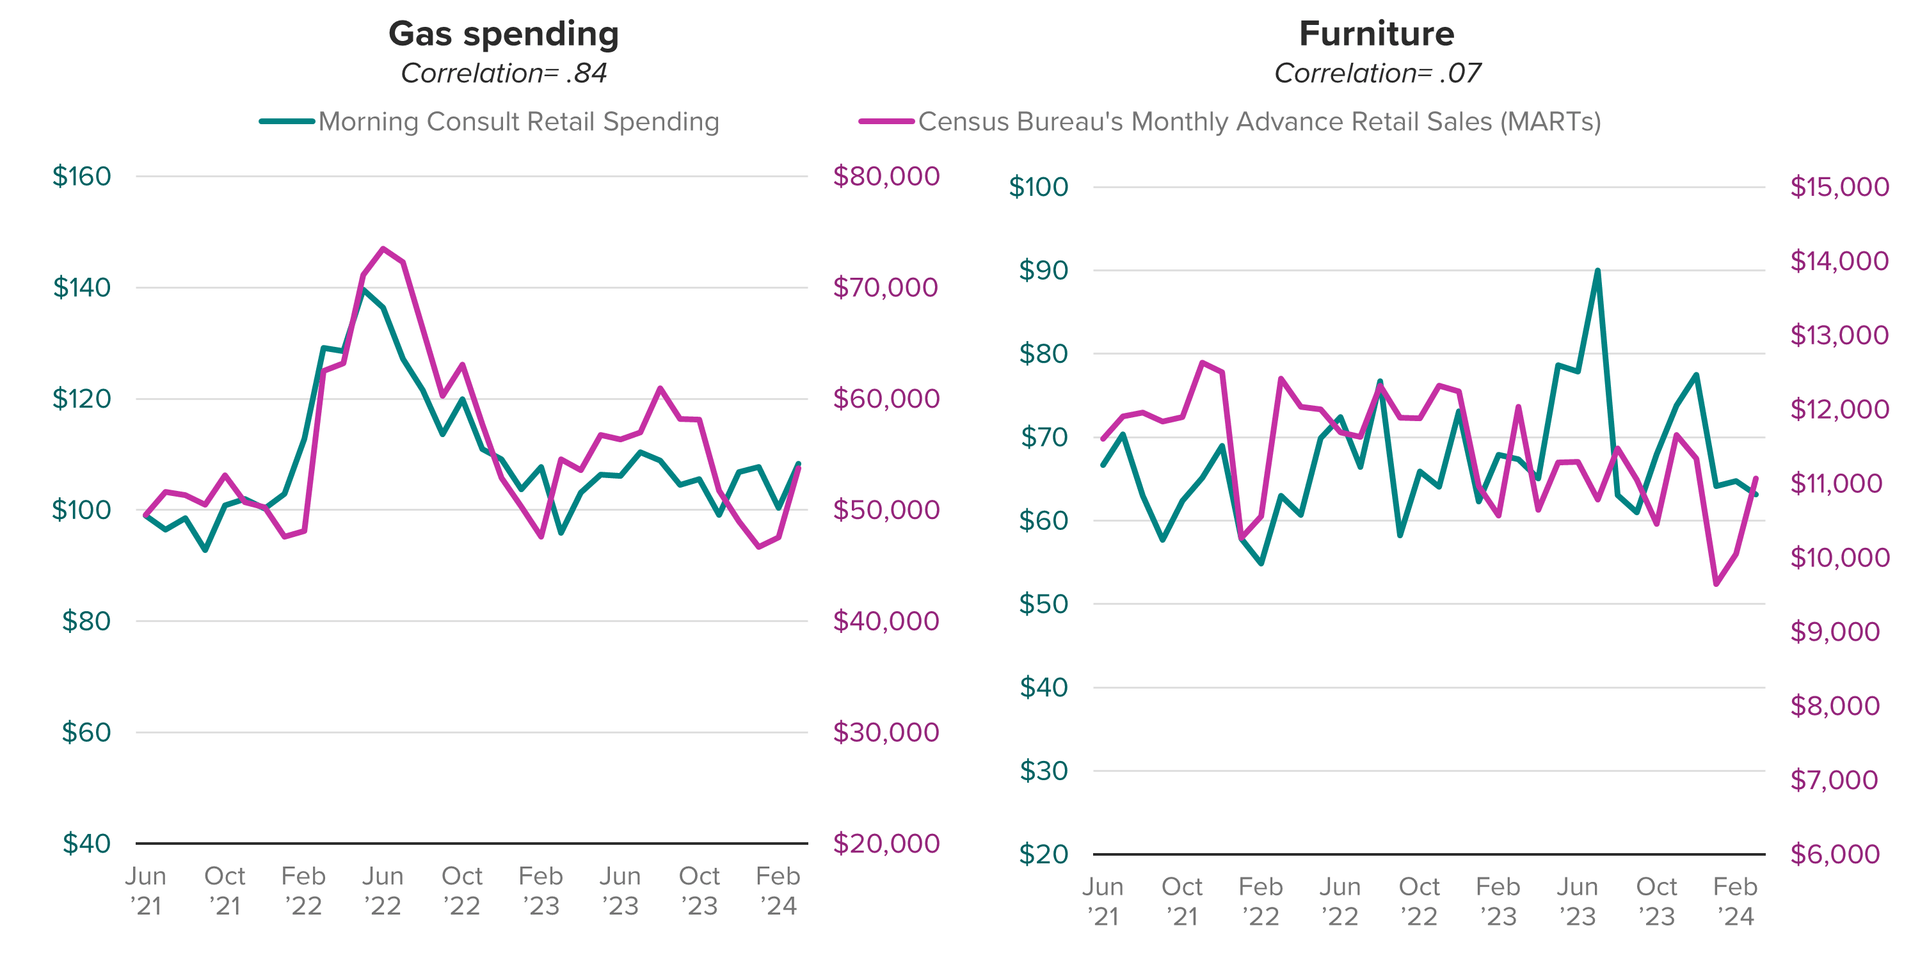
- Category-specific nuance: Since the MARTs data is grouped by business type and Morning Consult’s data is grouped by type of good or service agnostic to the purchasing channel through which a given item was obtained, there may be mismatches in spending patterns when store types and categories do not have a 1:1 relationship. For example, furniture can be purchased from furniture stores – or it can be bought from department stores, online, or even second-hand. Morning Consult’s home furnishings category would encompass all of these outlets, whereas the MARTs furniture and home furnishing store category covers only the brick and mortar subset. This mismatch, in addition to the potential impact of BNPL, contributes to an expectedly weak correlation between the respective home furnishing components for Morning Consult and MARTs. Conversely, gas spending from Morning Consult has a very high correlation with the MARTs gas stations spending component (.84), since effectively all gas is purchased from gas stations and most of what is bought from gas stations is gas.
Correlation With Benchmarks Depends on Category-Specific Characteristics
Total spending benchmark: Bureau of Economic Analysis’ Personal Consumption Expenditures
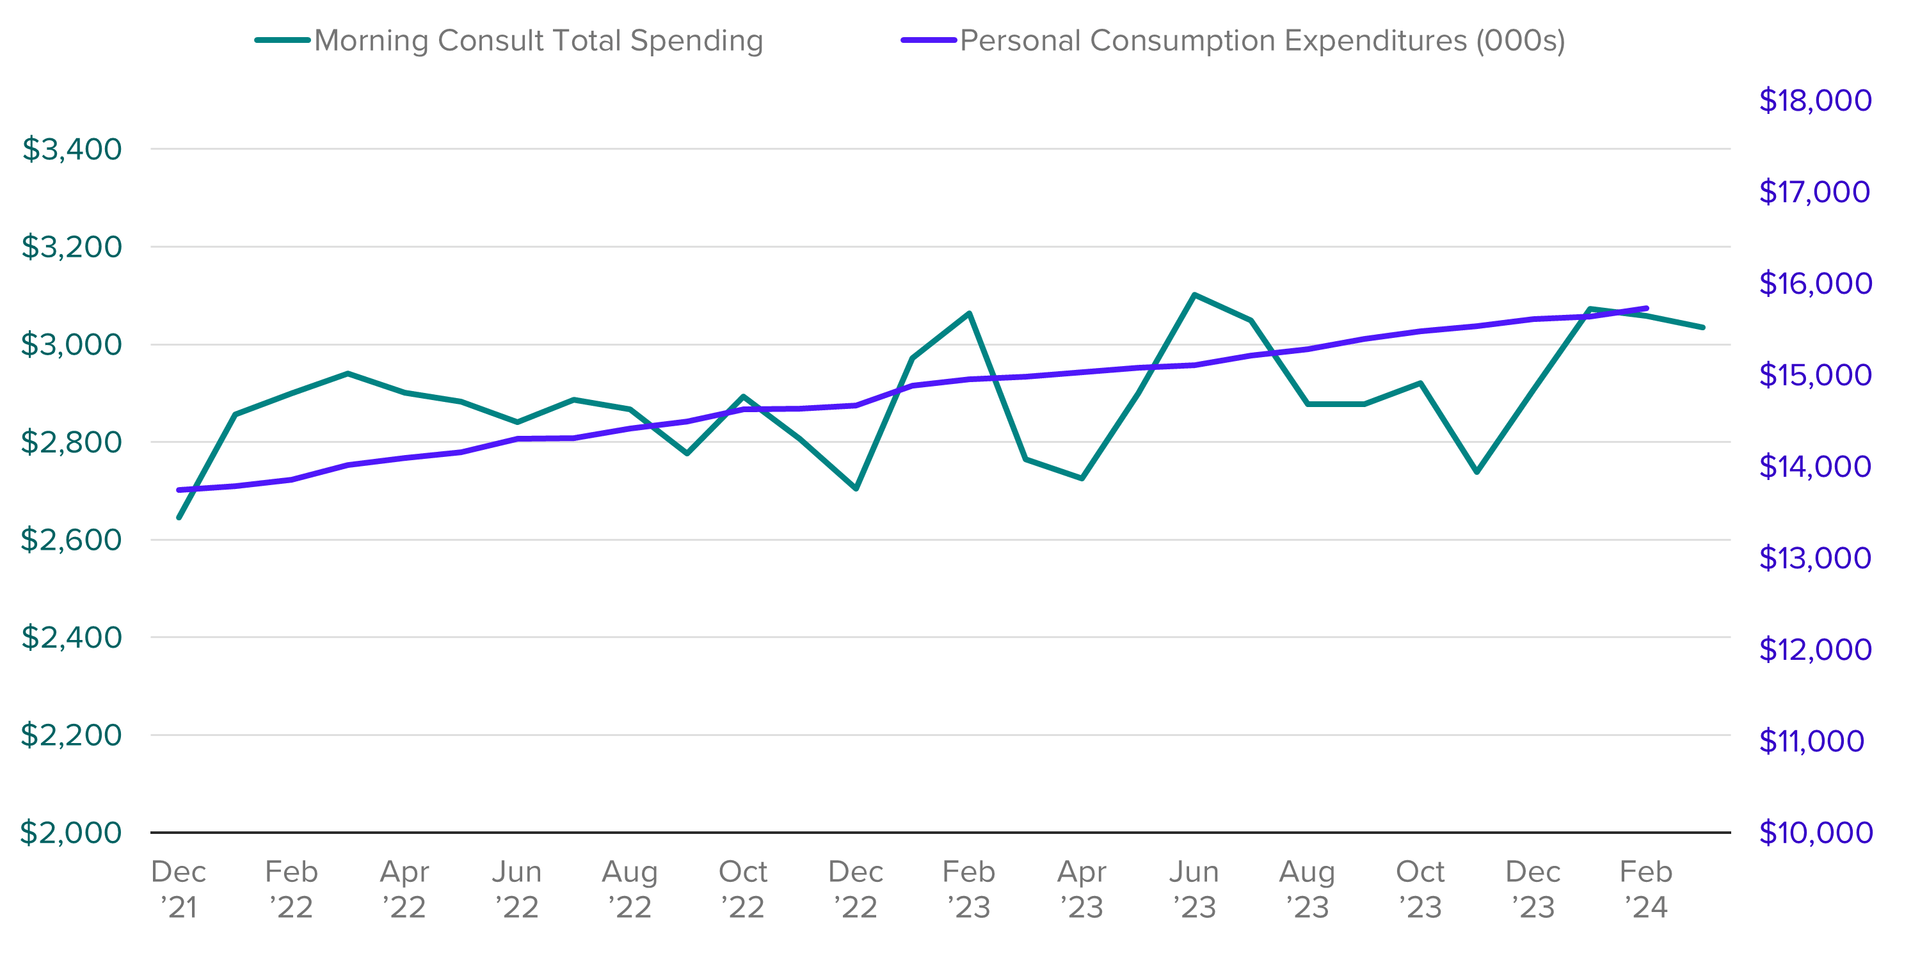
In terms of coverage, the monthly personal consumption expenditures (PCE) data from the Bureau of Economic Analysis is more similar to the mix of goods and services covered by Morning Consult: Both datasets cover a broad range of goods and services more reflective of overall consumer spending than the more limited retail sales report. In the long run, these measures trend in a similar direction given the basic similarities in the underlying concept being tracked. However, there are methodological differences between the two sources that can at times lead to divergent monthly trends, summarized below:
Morning Consult’s Total Spending Trend Resembles PCE, But With More Volatility
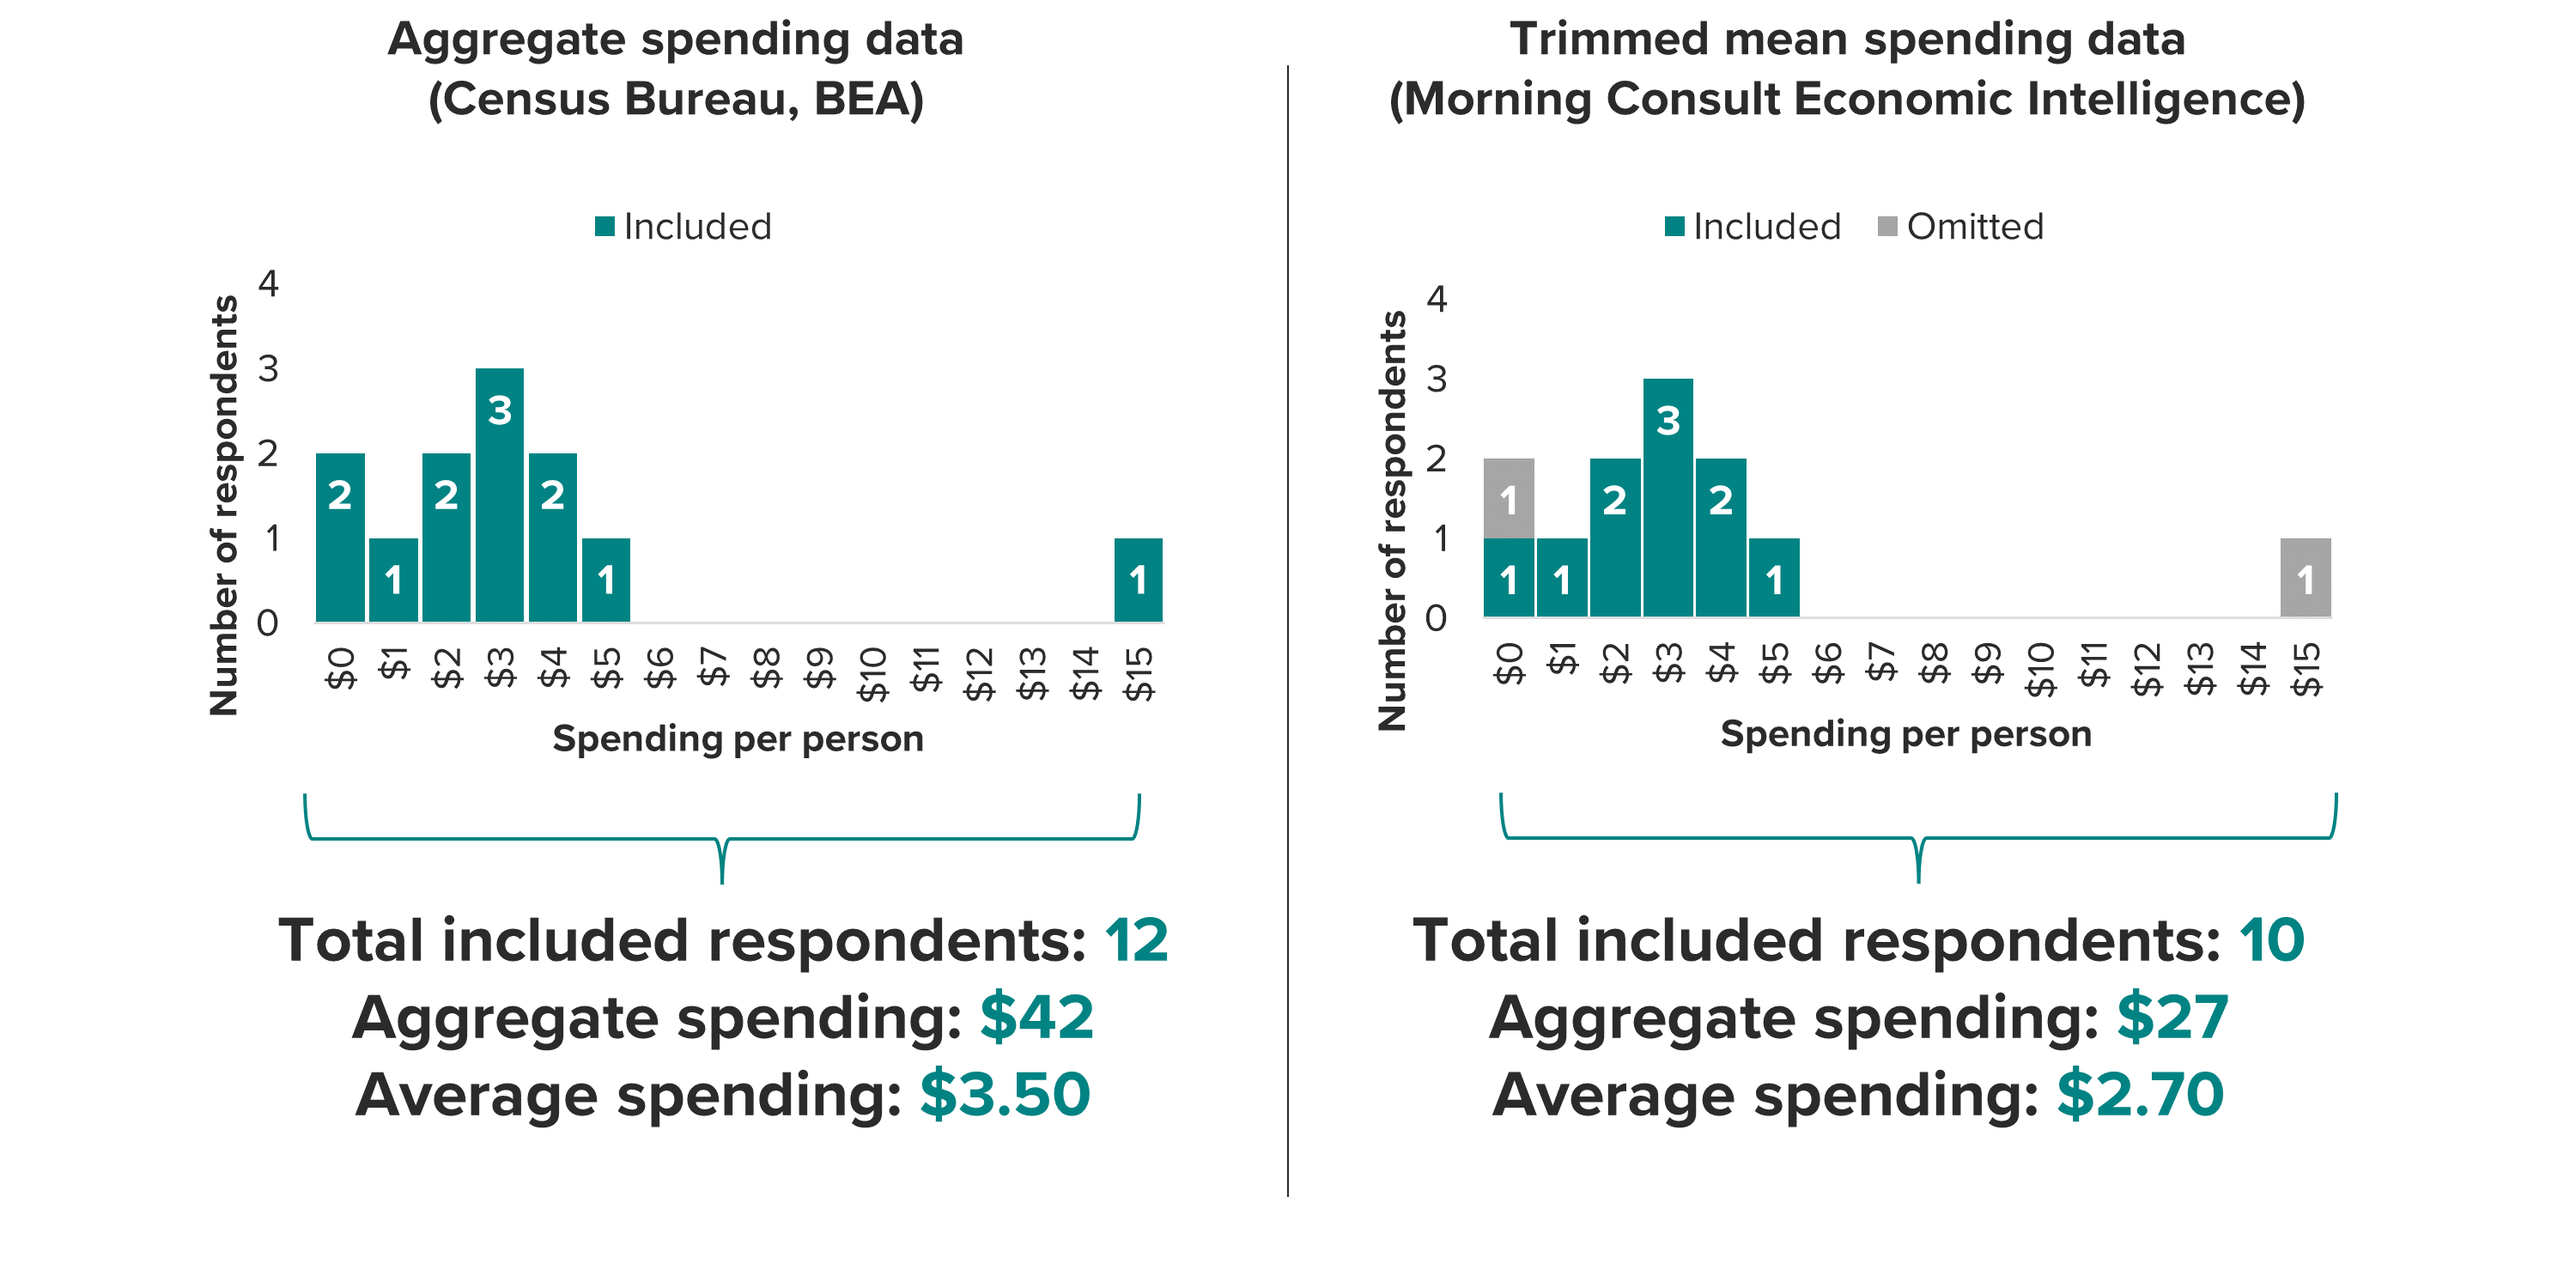
- Aggregate vs. trimmed mean: To estimate PCE, the BEA draws from multiple government and industry data sources to tally up aggregate monthly spending on consumer goods and services categories. Rather than an aggregate number representing total spending by all consumers, Morning Consult seeks to estimate an average representative spending level per household, per month. The chosen statistic for this is a trimmed mean, the calculation of which intentionally strips out outliers for each spending category to reduce volatility and preserve representativeness of the average consumer’s spending. In theory, the trend for the average would be expected to correlate with the trend for aggregate (PCE) spending, however variability from high-end outliers could cause differences. An extremely large outlier in a certain category in a given month would exert a disproportionately large influence on driving up PCE, but would have no weight on Morning Consult’s average spending figure because it would be omitted during the post fielding process.
Illustrative Example of Methodological Differences: Same Sample, Different Outcome
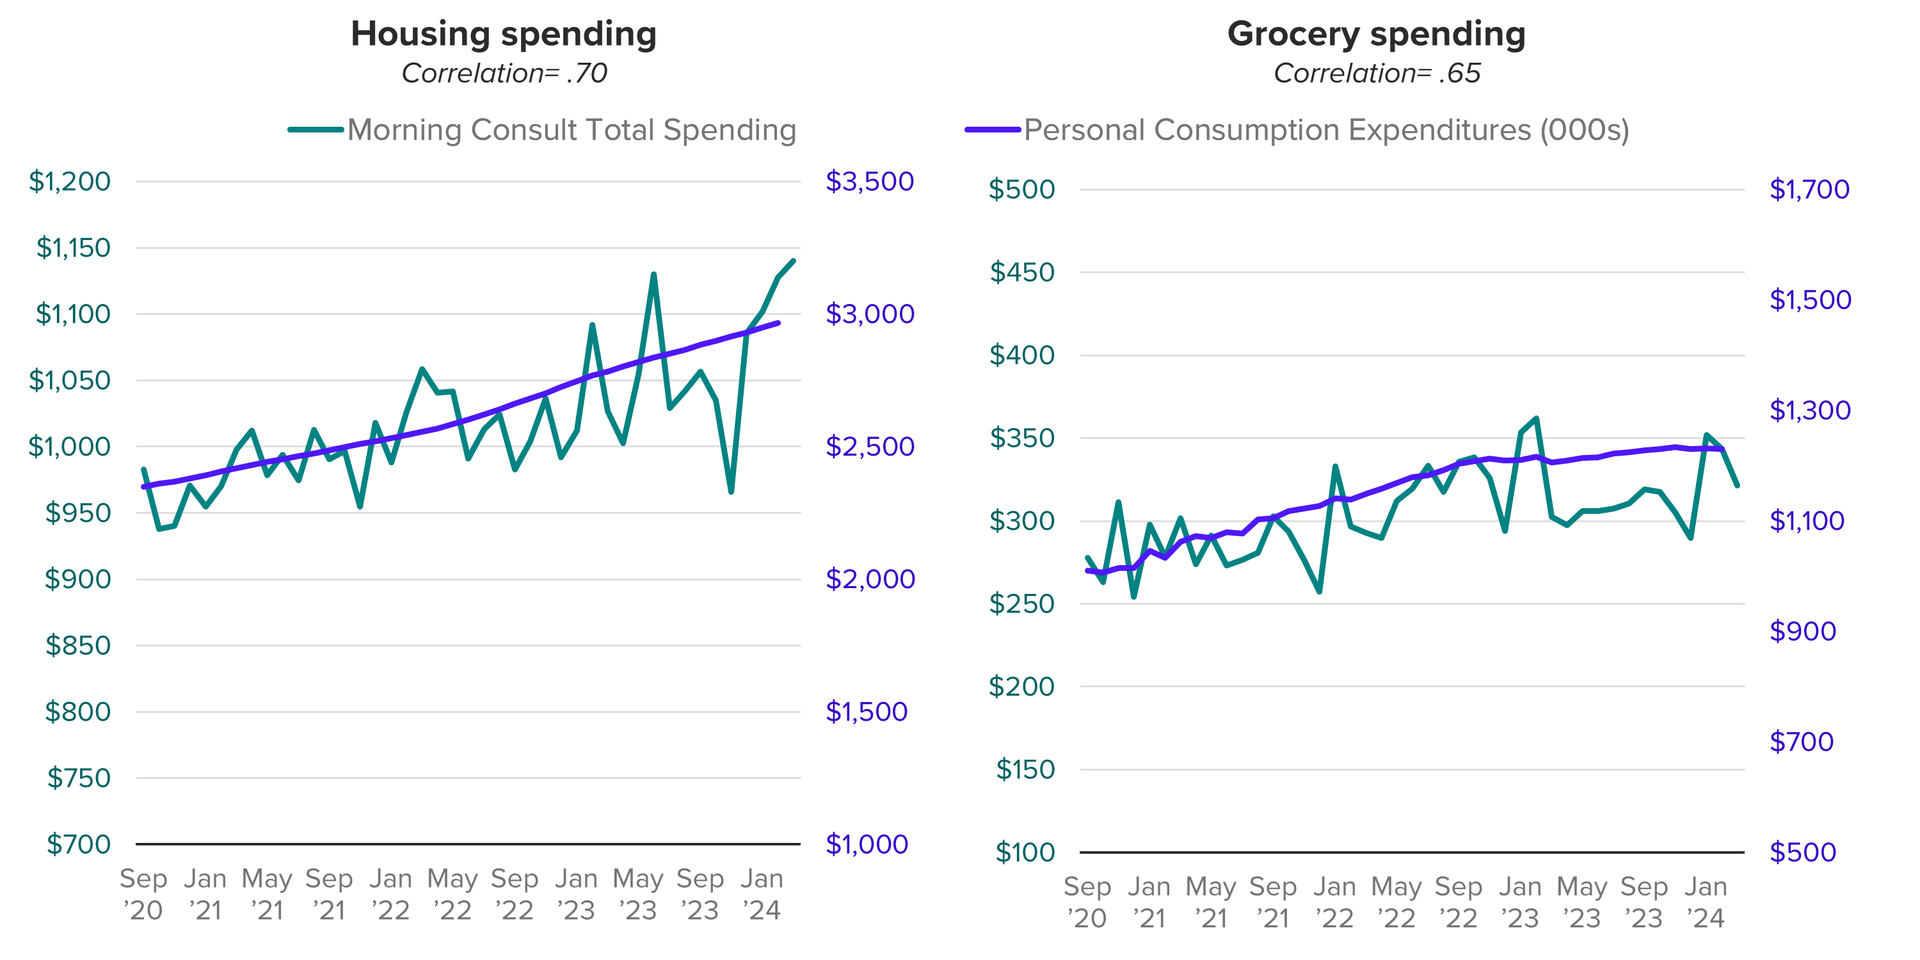
- Seasonal factors and excess volatility: The BEA’s spending data is released as a seasonally adjusted annualized rate. Morning Consult’s data is also viewable with seasonal adjustments, however at the time of this writing there is insufficient history for robust calculation of seasonal effects specific to this dataset – our preferred approach, to be implemented in the future once enough time series accumulates. In the meantime, the current adjustment factors applied to each category are derived from corresponding categories in sources including the BEA and MARTs. While this interim method is partially effective at reducing the impact of seasonal effects in Morning Consult’s data, it is suboptimal to the preferred method and likely allows for some excess volatility in spending tied to seasonal factors. Furthermore, the overall lower sample size for Morning Consult’s data (2,200 U.S. adults per month) also contributes to more variability in spending from month to month compared with PCE. Components with less seasonal fluctuation, like housing and groceries, have a closer correlation.
Largest Spending Categories Have Moderately Strong Correlation with PCE
- Sample/source data: Similar to MARTs, many of the PCE categories draw upon data from businesses rather than directly from households. In fact, MARTs data is one of the sources used for some retail components of PCE. Similar differences in timing of revenue recognition as described above with respect to retail data could therefore be a factor in driving discrepancies between Morning Consult’s spending data and PCE. Outside of retail goods, services like travel may be subject to these timing differences as well. For example, consumers are likely to book a flight one or more months in advance and record the purchase at the time of the booking, whereas standard accounting practices would dictate that airlines recognize the revenue at the time the service (the flight) is completed.
- NPISHs: In addition to spending by consumers, PCE data includes spending by nonprofit institutions serving households (NPISHs) on behalf of U.S. households. This element has a large impact on health care costs, as insurers and government are responsible for a substantial portion of payments on behalf of consumers for these categories. This could impact a number of other categories as well. Tuition assistance, SNAP benefits and employer-paid travel and dining expenses could potentially show up in PCE. Morning Consult queries consumers on their household’s direct purchasing habits with the aim of tracking their specific monetary flows, so any third-party purchases sit outside the purview of this dataset.
Morning Consult’s role in the spending data landscape
The key to unlocking the most value from Morning Consult’s spending data is understanding both its benefits and limitations relative to other sources. Self-reported consumer survey data is not intended to replace “official statistics” as a measurement of overall economic activity. Rather, this data, representative of the average, everyday consumer, should be viewed as complementary to the aggregate statistics available from government agencies. The same attributes that lead to differences between Morning Consult’s data and Census Bureau or BEA data are tied to unique advantages of this dataset. For example, surveying directly from the consumer perspective tells us the actual outflow of household earnings to various categories each month, agnostic of store type or payment method, or whether a transaction involved financing or not.
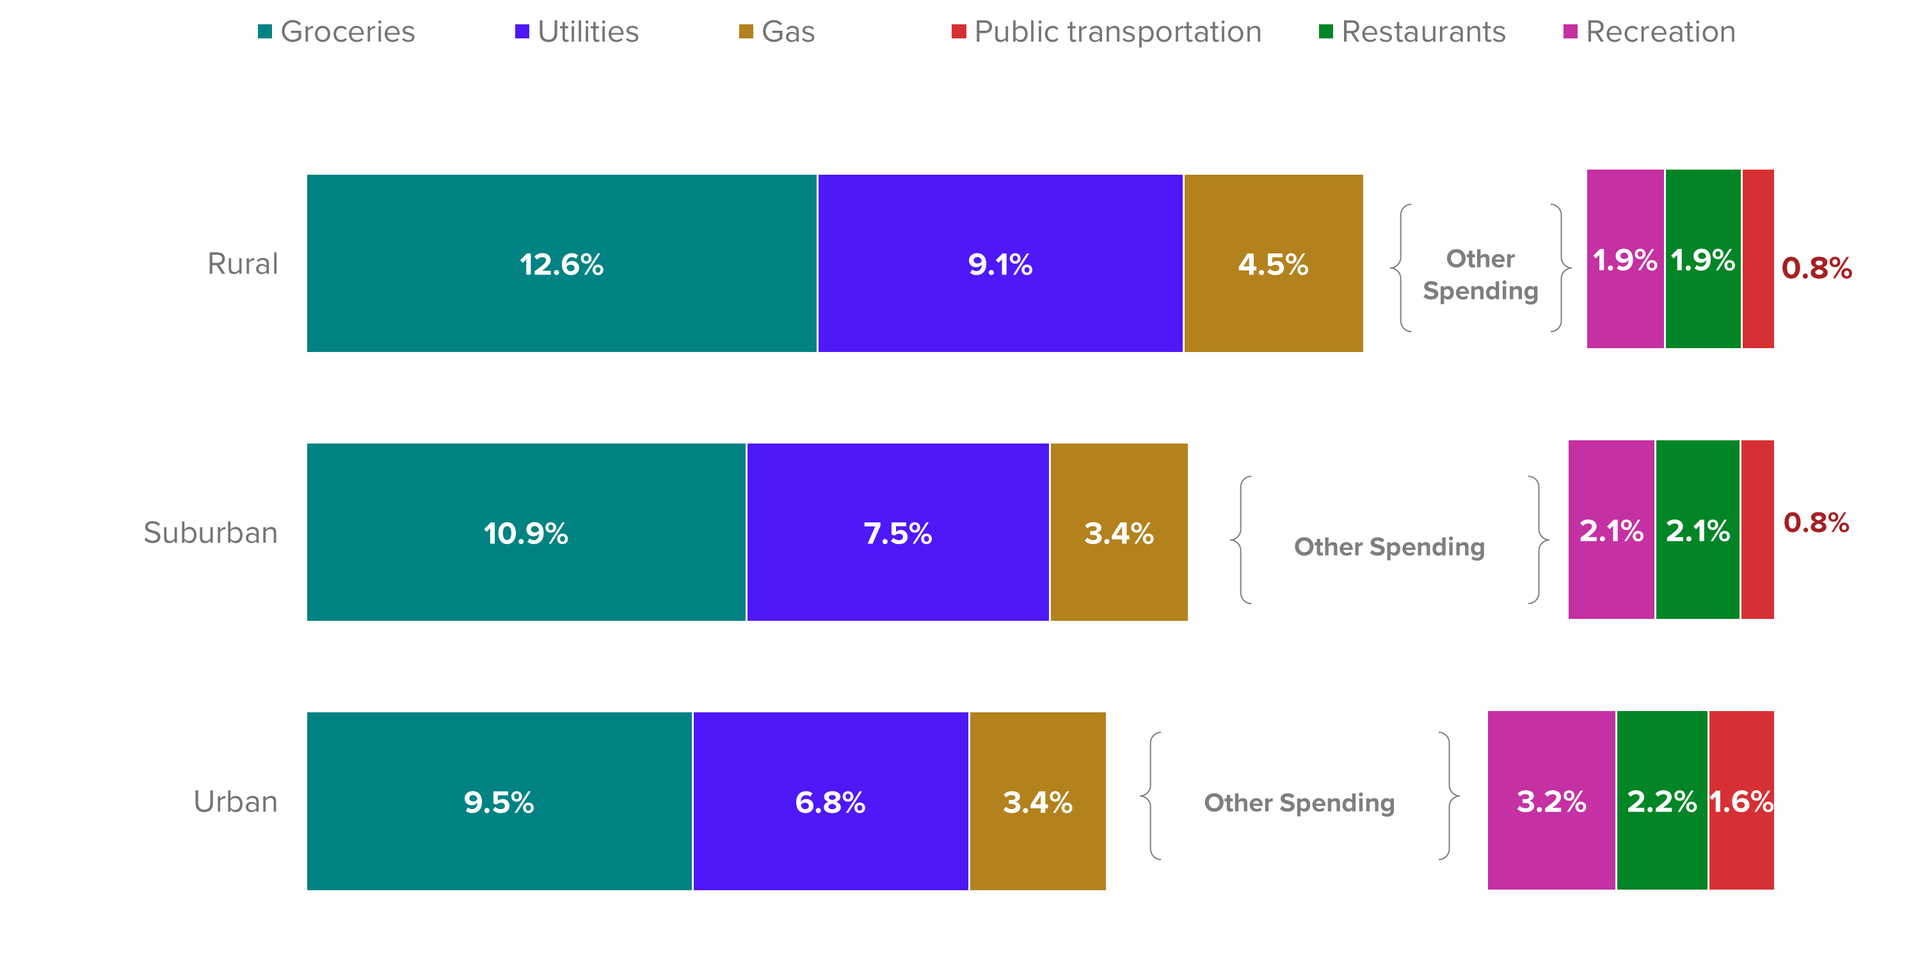
One of the most compelling features of this consumer-centric survey data is that it allows us to isolate spending patterns for specific demographic groups. Characteristics such as age or generation, income, parental status, and geographic location can lead to substantial differences in consumers’ economic circumstances and associated buying behavior. For instance, rural-located households tend to allocate a much higher share of total spending to categories like groceries, gas and utilities, while certain service categories make up a larger share of wallet for those living in urban areas.
Spending Priorities Differ For Rural, Suburban and Urban Adults
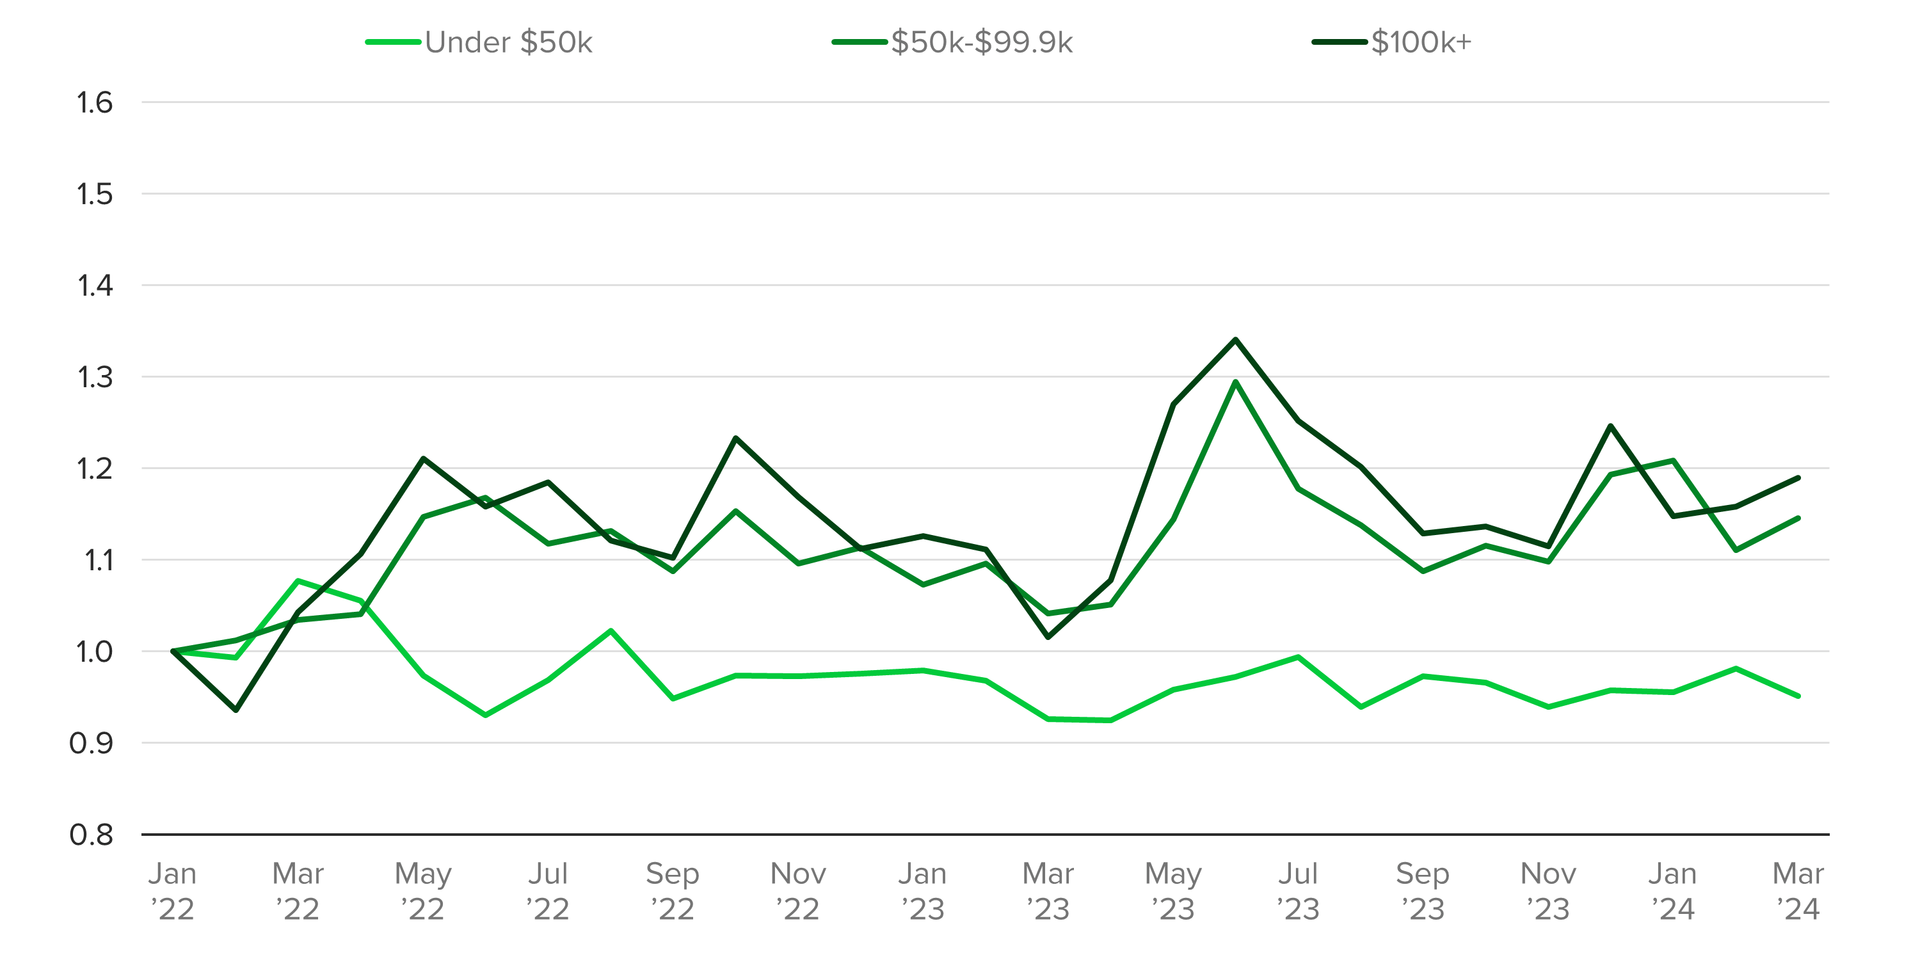
Additionally, much of our past research has focused on disparities in spending outcomes across income groups. As the U.S. economy emerged from the pandemic, topline government spending data showed strong consumer spending despite headwinds like elevated inflation and interest rates. Morning Consult’s data suggests that seemingly resilient spending was disproportionately being driven by higher earning groups.
Higher Income Groups Drove Spending Growth Since 2022
The value of demographic specificity in our spending data is dramatically increased when tying it together with Morning Consult’s full offering, including other economic datasets–covering topics like inflation and price pressures, consumer debt, sentiment and labor–as well as industry, political and even brand-related research. Since isolating specific demographic groups is possible across all of these datasets, combining these viewpoints makes it possible to craft a thorough and nuanced picture of how the mindsets, actions and future plans of these consumers are evolving over time across any number of metrics.
Case studies:
Rising fast food prices hit consumers where it hurts
Middle Class Americans Are Acting More Like Lower Income Earners
Higher Debt Burdens Could Be Driving Up Price Sensitivity
More Money From “Side Hustles” Provides Spending Tailwind
Kayla Bruun is the lead economist at decision intelligence company Morning Consult, where she works on descriptive and predictive analysis that leverages Morning Consult’s proprietary high-frequency economic data. Prior to joining Morning Consult, Kayla was a key member of the corporate strategy team at telecommunications company SES, where she produced market intelligence and industry analysis of mobility markets.
Kayla also served as an economist at IHS Markit, where she covered global services industries, provided price forecasts, produced written analyses and served as a subject-matter expert on client-facing consulting projects. Kayla earned a bachelor’s degree in economics from Emory University and an MBA with a certificate in nonmarket strategy from Georgetown University’s McDonough School of Business. For speaking opportunities and booking requests, please email [email protected]